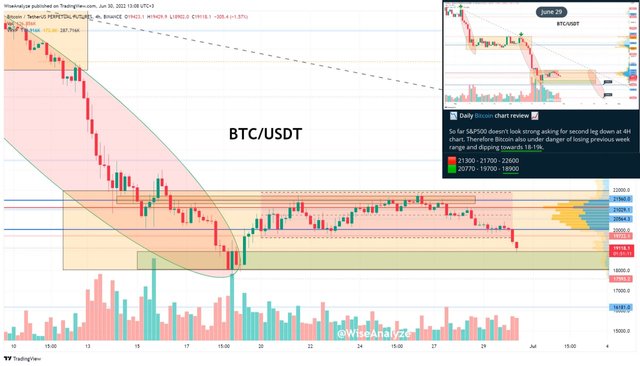
📉 Daily Bitcoin chart review 📈
Everything I warned about yesterday now in play. S&P500 made second leg down to 3760 and Bitcoin dip to 18900. This can be only a start of the last bearish impulse wave with final target yet hard to predict, but most probably 16k at least, maybe 14k. That bearish scenario may be invalidated if BTC manage to bounce from Bullish OB at 18-18.9k area. But to confirm that bounce we'll need at least several days of price action so that won't be clear until next week.
🟥 19700 - 20770 - 21300
🟩 18900 - 18300 - 17600
😱 F&G: 11 <= 13 <= 10 <= 12
💩 Alts: 61% < 64% < 69% < 67%
Signals: 🔥 Alts Watchlist 💷 Forex 🐦 Twitter
Discounts: ByBit | Binance | FTX | KuCoin | PrimeXBT| BitGet | Delta | Gate | Huobi | MEXC
