Did BTC start its Uptrend? once and for all ?
Stagnation! This is the word that we have to keep in mind if we are to look at historic price action of BTC! Any asset usually "breathes out"/"Stagnates"/"Ranges"/Consolidates" for a period of time following a bullish/bearish run!
We have been seeing a gradual increase in BTC price with no major bull runs neither bearish slides. Here are the key support and resistance zones for BTC and various scenarios we may have!
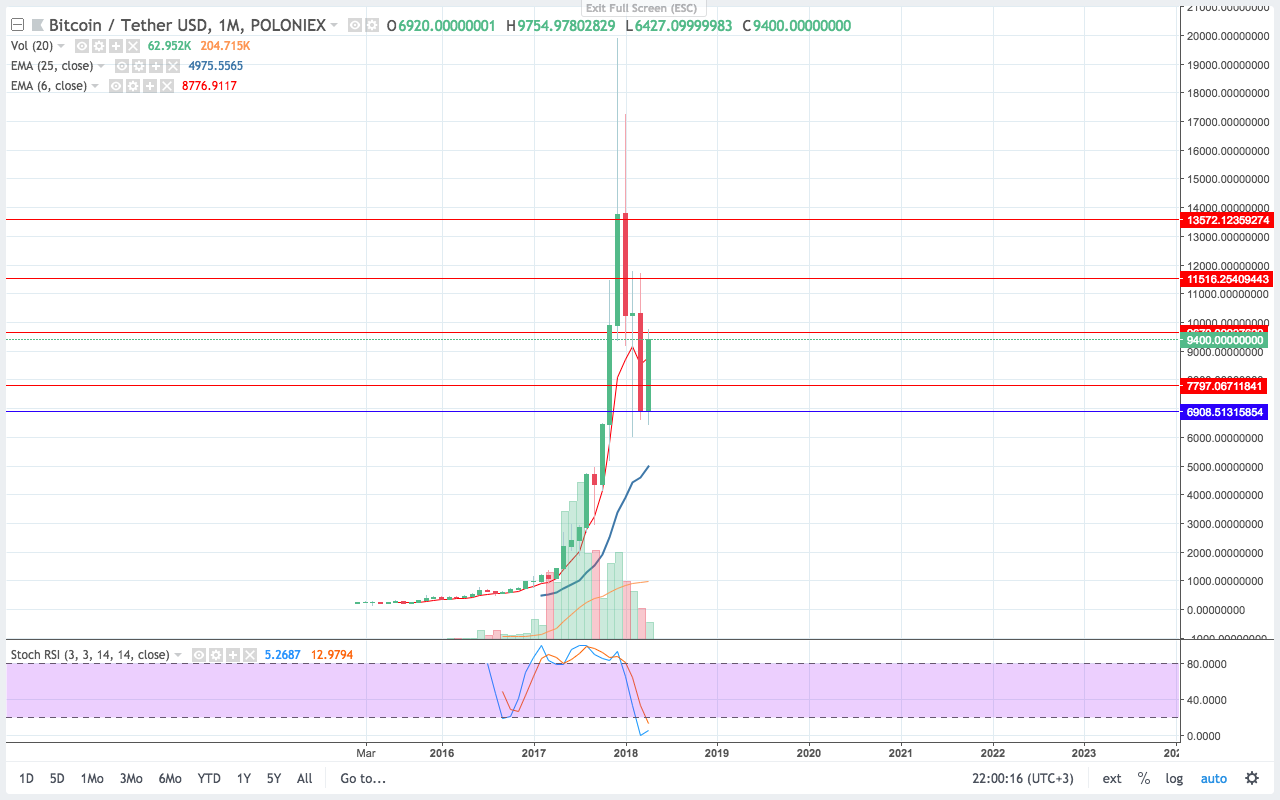
Monthly:
This month's candle started below the fast (red) moving average! it was a sure sign that price is going to hit 4800 level; which also happened to be the next fast (blue) moving average! however , things took a turn with major buy orders, pushing the price above the monthly moving averages and found a strong support at 6900 . Currently, BTC price is trading above both moving averages again, should it hold for the next few days until a new monthly candle is formed, then we are in a good shape.
It is also very important to note that the monthly stochastic for BTC has reached overbought zone and is showing slight signs of an uptrend!

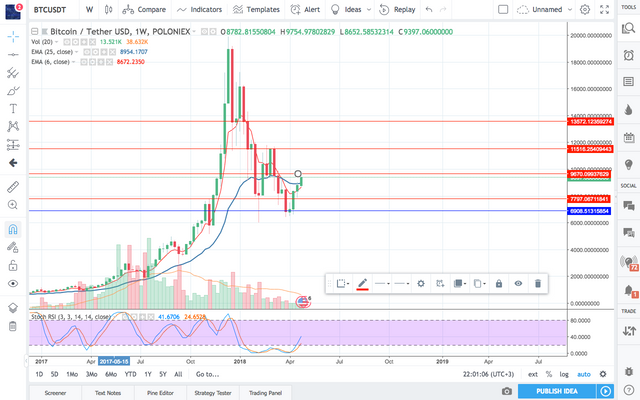
Weekly: The Weekly Price on BTC tells us that the price is in a strongly upwards trend! This is signaled by the price's ability to bounce of 6900 daily support ( blue line) and breaking and closing above the next resistance which now acts as a support! This is all great news so far! Currently, BTC needs to test the 9700 resistance level! this will be very critical in telling us if BTC is going to grow organically or find resistance and crumble back to previous supports! The Stochastic indicators on the weekly chart are in favor for a continued uptrend, specially that early reversal signals are shown on monthly stochastic

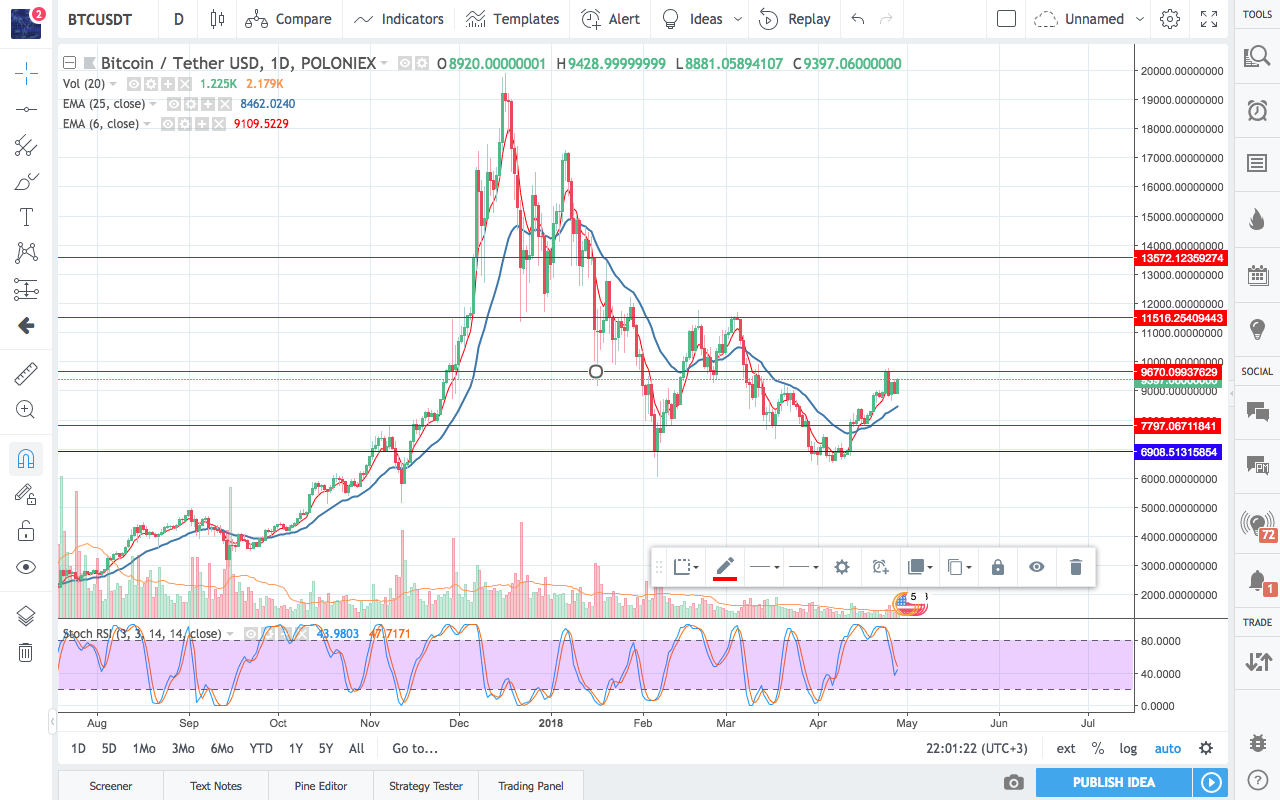
Daily :
For the past 3 days, BTC price has been ranging and seems to be attempting to break out beyond 9700 level anytime soon! if it succeeds to break and close above 9700 on daily, the we are to look at the next resistance level at 11500. If it didnt we may see it fall back to 7800 level! The latter scenario is unlikely, since stochastic daily lost its downward momentum, and seems to be influenced by the reversal on the monthly and weekly stochastic indicators!

Lets sum it up! Despite buying signlas being prominent! we need to remember that prices range for a while before a new bull run occurs! this may take a while, or it may happen sooner than we think! as for the 4800 level (which i strongly believed in) all indicators to that level seems to have vanished! 6900 level was a very strong support level at which price started to bounce off! fingers crossed for BTC