Application and improvement of bridge cable broken wire acoustic emission monitoring system
Application and improvement of bridge cable broken wire acoustic emission monitoring system
Zhang Lidong, Liu Shifeng, Wang Shuang, Xie Jiehui,
QingCheng AE institute (Guangzhou) Co., Ltd, Guangzhou 510663
Abstract: With the release and implementation of "JT/T 1037-2022 Technical Specifications for Highway Bridge Structure Monitoring" and the draft for comments on related industry standards, the use of acoustic emission technology to monitor cable wire breakage has been extended from laboratory applications to field applications. Cable wire breakage has become a key monitoring target for bridge structure safety, especially for cables in suspension bridges, cable-stayed bridges, and arch bridges in long highway bridges. This paper systematically describes the application of acoustic emission technology in the test and on-site application, and proposes feasible improvement suggestions for the problems encountered in the implemented projects to solve the bottleneck problems encountered in the current monitoring of cable wire breakage.
Keywords: Acoustic emission Cable Broken Wire Bridge Structure
1 Introduction
After years of mechanical tests on steel strands in bridge cables and acoustic emission detection and verification of structures such as bridge sling cables and main cables on site, domestic scholars have updated the Technical Specifications for Monitoring Highway Bridge Structures from the 2016 version to the current JT/T 1037-2022 version, in which Item 8.5.5 clearly states: Acoustic emission monitoring methods should be used for broken wire monitoring. For broken wires in suspension bridge slings, main cables, cable-stayed bridge cables, arch bridge suspenders (cables), tie rods and other steel cable structures exposed to the air, acoustic emission sensors with higher resonant frequencies can be used. The working temperature range should be -30 ℃ ~ 70 ℃, and the working frequency range should be 40 kHz ~ 100 kHz; for broken wires in prestressed steel cables buried in concrete, acoustic emission sensors with slightly lower resonant frequencies can be used, and the working frequency range should be 10 kHz ~ 40 kHz. Item 7.5.5: For main cables and suspenders of cable bridges, cable-stayed bridges, and arch bridge suspenders (cables) and tie rods, which are rated as "corroded" or "rusted" with a scale of 3 or above according to JTG/T H21, it is advisable to set broken wire measuring points. The measuring points can be set at the head end position or the position of broken wires that are prone to corrosion. Table 8 Sampling frequency of structural change monitoring content The table mentions a 2M sampling rate to trigger collection. The specification only points out the hardware configuration, alarm content and monitoring location, and does not specify the specific installation location on the cable and the configuration of acoustic emission parameters. This article comprehensively describes the test and the acoustic emission of broken wires of installed suspenders, and puts forward feasible improvement suggestions for the problems encountered in the implemented projects.
2 Current status of acoustic emission technology and products
The phenomenon that a material emits transient elastic waves due to the rapid release of energy is called acoustic emission, also known as stress wave emission. The technology of detecting, recording, analyzing the sound source signal with the help of sensitive electronic instruments and inferring the acoustic emission source by using the acoustic emission signal is called acoustic emission technology. Its system is mainly composed of acoustic emission acquisition instrument (card), preamplifier, sensor and computer and software based on Windows operating platform. At present, the simplified waveform characteristic parameter analysis method of acoustic emission is a classic analysis method widely used since the 1950s. Almost all acoustic emission detection standards use simplified waveform characteristic parameters as the criterion for the acoustic emission source. Generally, only the acoustic emission data exceeding the set trigger threshold are recorded and analyzed. In laboratories and engineering applications, it is generally believed that the lower the threshold setting, the better the signal can be captured. However, in terms of wire material testing machine stretching, simulated wire breaking, and bridge cable noise testing, it has been proved in practice that this rule does not need to be followed.
In the process of converting laboratory results into engineering monitoring applications, acoustic emission technology faces two main technical difficulties: first, the acoustic emission instruments on the market are generally multi-channel systems, and the number of channels cannot be configured according to the actual monitoring point requirements, resulting in unnecessary cost increases; second, the acoustic emission instrument mainly relies on a computer based on the Windows operating platform to work, and the computer crash and restart will cause the communication of the acoustic emission instrument to be interrupted, requiring human intervention to recover. The problem that needs to be solved at present is to match the corresponding number of channels according to actual needs and to create an acoustic emission system that can work without relying on an industrial computer placed on site.
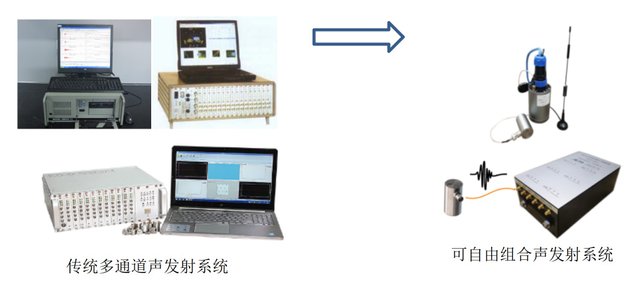
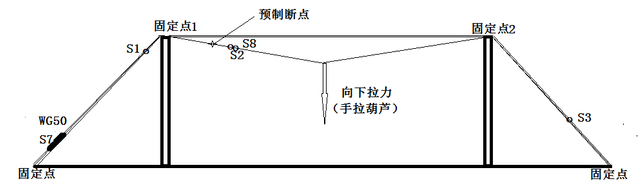
Figure 1 Transformation of acoustic emission detection system
3 Basic test of cable wire breakage
3.1 Simulate the collapse of a single steel wire
3.1.1 Test conditions
Thesingle steel wire is fixed by using the concrete beam column of the factory building as a fulcrum. The test object is a single 7mm diameter steel wire commonly used in cables, with prefabricated slot defects. The manual hoist is used as an external force application method. The hoist is manually tightened until the steel wire breaks. The acoustic emission signal during the test is received by sensors of different frequencies installed on the steel wire. The acoustic emission instruments and performance used are as follows:
SAEU2S-8 acoustic emission detector: 10M sampling rate, 16bitAD;
G150 acoustic emission sensor: center frequency 150KHz, working frequency domain: 60~400KHz;
WG50 acoustic emission sensor: frequency domain range: 50~800KHz;
PAI preamplifier: working frequency domain: 20~1200KHz, 40dB (100 times) amplification
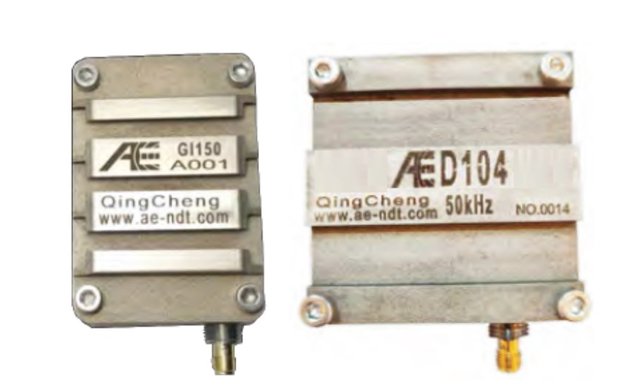
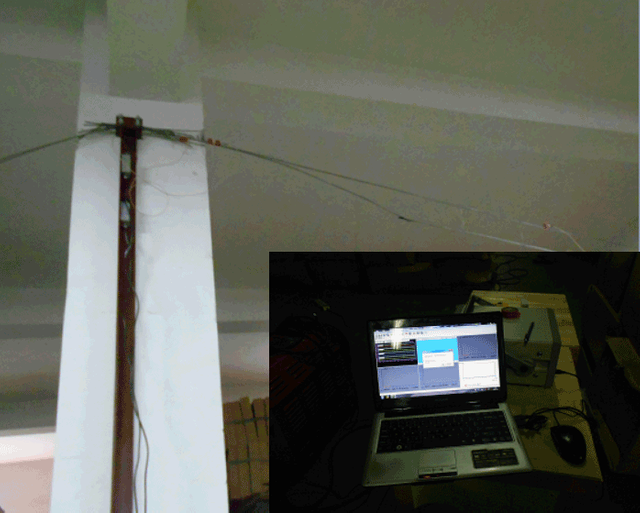
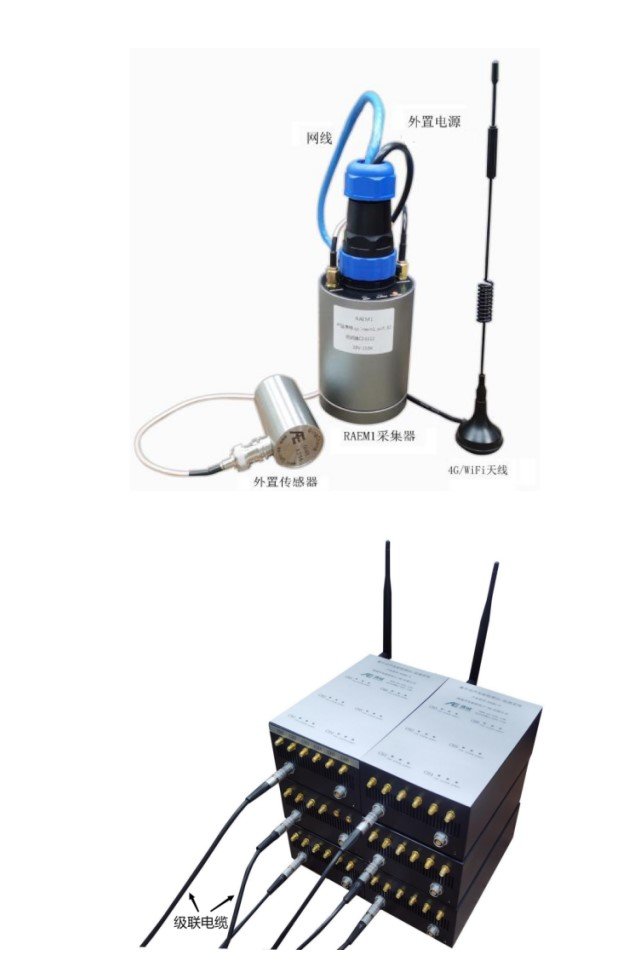
Figure 2 Schematic diagram of installation with a single steel wire breakage
3.1.2. Parameter configuration and installation
The industry generally believes that the frequency domain of carbon steel crack signals is mainly distributed in the range of 100-300kHz. However, due to the influence of the size structure of the test object and the sound wave transmission path, its frequency domain characteristics may change. Therefore, a narrow-band sensor suitable for metal crack detection and a wide-band sensor convenient for frequency domain analysis are selected in the sensor frequency domain, and corresponding considerations are made on the installation position.
Table 1 Sensor installation location and AE parameter configuration
Sensor No. model Location Filter band
S1 G150 The distance from the fixed point 1 is 500mm; the distance from the pre-breaking point is 1800mm 100kHz—400kHz
S2 G150 300mm from the fracture position 100kHz—400kHz
S3 G150 13500mm from the fracture position 100kHz—400kHz
S7 WG50 Distance from fracture position 5300mm 20kHz—1200kHz
S8 WG50 300mm from the fracture position 20kHz—1200kHz
General acoustic emission configuration:
sampling rate = 3000kHz, threshold = 40db, HDT = 2000us, PDT = 1000us, HLT = 20000us
3.1.3 Attenuation
The 150K resonant sensor S2 and the broadband sensor S8 installed close to each other were used as the acquisition channels, and the signal attenuation of a single steel wire was tested by breaking a lead core with a diameter of 0.5 and a hardness of HB as a simulation source. In order to simulate the attenuation characteristics of the acoustic emission signal on the steel wire under actual working conditions, the steel wire was pre-tightened by a manual hoist, and then the lead breaking test was performed at different positions of the steel wire. The on-site and data results are as follows:
Figure 3: Steel wire breaking test site
Table 2 Attenuation test results
Distance/m
Measurement value/dB 0 0.1 0.5 1.0 2.0 3.0 5.0 7.0 9.0 11 14
S2 (150K resonance) 100 92 86 79 80 79 72 69 64 59 45
S8 (Broadband) 99 90 82 77 73 67 62 60 55 46 /
3.1.4 Test results
A total of 4 pull-off tests were conducted during the experiment. The first test was for a new steel wire with prefabricated slot defects. After the fracture was lap-welded, the gap was prefabricated again and repeated. Because the steel wire fracture was welded multiple times and the fixed point structure was disassembled and installed multiple times, the subsequent 3 pull-offs not only verified the types of broken wire acoustic emission characteristic parameters, but also generated some interference source signals. Under the condition of attenuation of the broken lead signal test, the resonant narrowband sensor has a longer receiving distance and its frequency response range is more targeted at the metal crack characteristics, so the reference 150kHz sensor is selected as the type of judgment parameter. In order to obtain the frequency characteristics of the steel wire breakage and avoid the misjudgment of the signal frequency band distribution caused by the resonant sensor resonance point, the sensor selected for frequency domain processing is a broadband sensor.
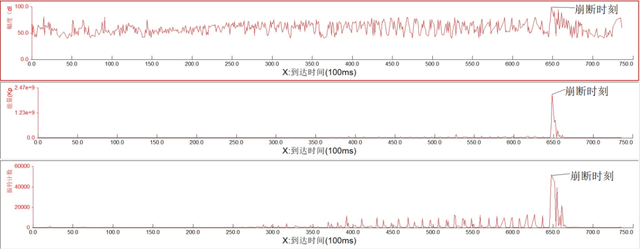
Figure 4 AE parameter history diagram of the new steel wire breaking process
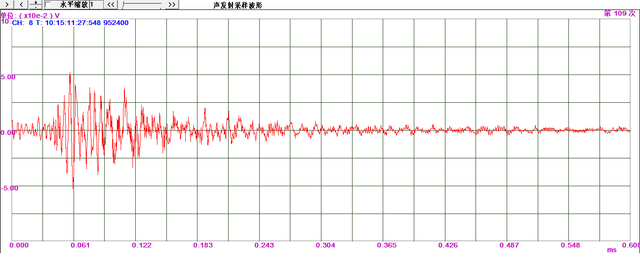
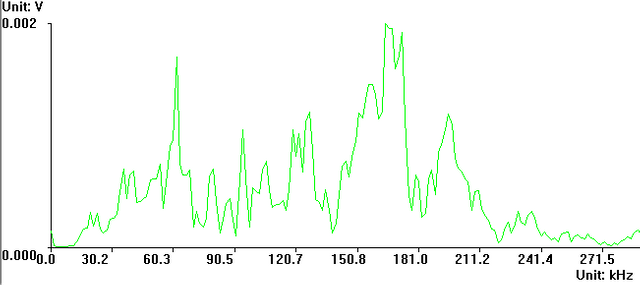
The broadband sensor receives the time domain signal before the fracture
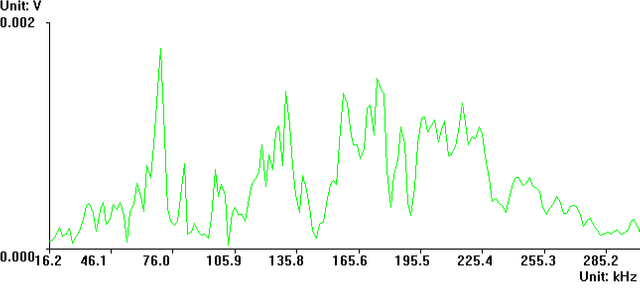
The broadband sensor receives the frequency domain signal before the fracture
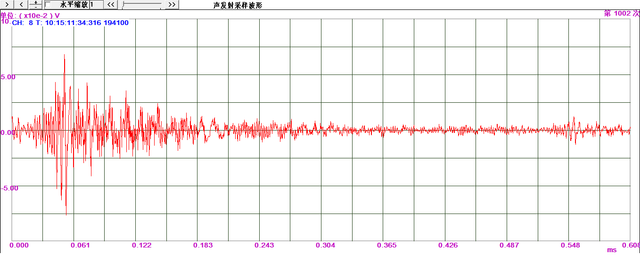
At the moment of fracture, the broadband sensor receives the time domain signal
At the moment of fracture, the broadband sensor receives the frequency domain signal
Fig.5 Time domain and frequency domain characteristics of the new steel wire breaking process
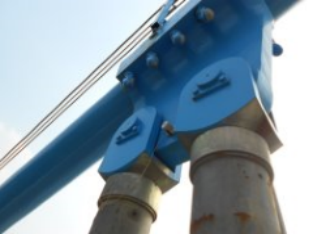
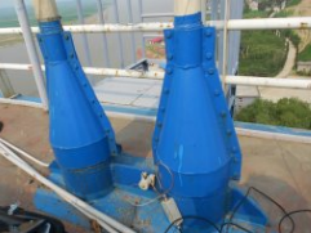
Fig.6 AE parameter history diagram of the first breaking process after weldingFig.7
AE parameter history diagram of the second breaking process after welding
Time Domain
Frequency Domain
Figure 8 Crack signal at welding position
Time Domain
Frequency Domain
Figure 9: Signal of wire sliding within the fixed point
3.1.4 Summary of this paragraph
- The accumulated values of amplitude, energy and ringing count in the acoustic emission characteristic parameters can be consistent with the moment of wire breakage, and the above three can be used to determine wire breakage;
- In the acoustic emission amplitude history diagram, the value displayed at the moment of wire breakage is 100dB, and the actual intensity is very likely to be greater than this value. This assumption can be confirmed in papers published by others;
- The acoustic emission signal of wire breakage is a relatively broadband signal. The near-point frequency of a single steel wire is mainly distributed between 50kHz and 200kHz, but as the distance between the breakpoint and the sensor increases, the high-frequency component will decrease accordingly. (This experiment was conducted in 2015. The resonant frequency range of the cable wire monitoring sensor should be within the range of 100kHz to 400kHz, which has been revised to 50-100kHz in the 2022 version.)
- The FFT spectrum peak of the sliding signal of the steel wire in the fixed point is displayed at 50kHz, which can be regarded as the friction signal between multiple strands of steel wire under the actual sling force to a certain extent.
4 Real bridge cable attenuation test
Based on the test results of the single steel wire in the upper part and the theoretical basis of the short propagation distance of high-frequency signals, a sensor with a resonant frequency of 40kHz and a frequency domain range of 15 to 70kH was selected to perform the acoustic emission signal attenuation test of the real bridge cable. The real bridge is located near the current Zhengzhou East Station. The side span main cable was selected for the test. Its structural situation is shown in the following schematic diagram:
Figure 10 Schematic diagram of the side span of Chaohe Bridge
4.1 Signal attenuation of the anti-corrosion layer
The SR40M (15-75kHz) sensor is placed on the upper half of the first lock clamp structure. The lead break signal is given at two locations 10 cm away from the sensor. The lead is broken 5 times at each location. The 3 maximum amplitudes are taken to calculate the average value. The positions are defined as P1 and P2. P1 is on the lock clamp and P2 is on the anti-corrosion layer outside the main cable.
Table 3 Anti-corrosion layer attenuation data
Position
measurement value dB P1 Position P2 Position
first 91 76
Second time 89 75
The third time 88 77
average value 89 76
4.2 Signal attenuation of the lock clamp structure
The sensor is fixed on the upper half of the lock clamp, and the lead-breaking signal is given at the typical position of the lock clamp to preliminarily measure the influence of the lock clamp structure on the acoustic emission signal
Table 4 Lock clamp structure attenuation data
Lead break position number Measuring amplitude
P1 90 dB
P2 87 dB
P3 80 dB
P4 73 dB
P5 68 dB
4.3 Propagation distance test
The sensor is installed on the anchor lock clamp (first lock clamp) at the bridge head for static noise collection. At that time, the test bridge was completed but not open to traffic, and the paint layer must not be damaged. The noise signal was less than 32dB. Since the catwalk will be climbed later to manually knock to give a simulated signal, the threshold is set to 40dB. Due to the attenuation effect caused by the anti-corrosion layer and paint, the lead break signal is not enough to be received by the distant sensor. Instead, the screwdriver knocks the lock clamp as the simulated source signal. The screwdriver knocks with moderate force to ensure that the knocking signal strength is lower than the signal strength at the moment of a single steel wire breaking and does not cause damage to the paint layer. The knocking position is each lock clamp, namely the first, second, third, fourth, fifth, sixth, and seventh lock clamps. Except for the first and second lock clamps at the bridge head, which are 7 meters apart horizontally, the remaining lock clamps are 5 meters apart.
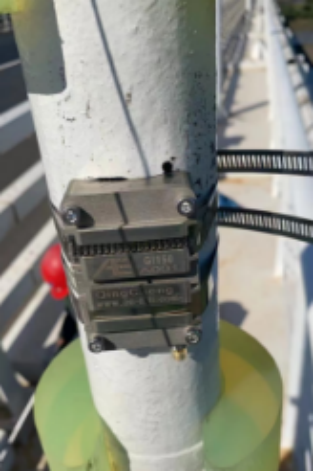
Figure 10: Location of the striking point
The blade end of the screwdriver is downward, and the free fall of 50cm to the upper surface of the lock clamp is used as an artificial simulation source. Each lock clamp position is free-falling 5 times, and the three maximum amplitudes before each lock clamp are recorded to calculate the measurement value. The data list is as follows:
Table 5 Propagation distance range list
Position
amplitude dB Lock clip 1 Lock Clip 2 Lock clip 3 Lock clip 4 Lock clip 5 Lock clip 6 Lock clip 7
first 100 78 55 52 43 43 /
Second time 100 80 53 56 41 45 /
The third time 100 87 53 50 47 41 /
average value 100 82 54 53 44 43 /
4.4 Summary of this paragraph
- The anti-corrosion layer of the main cable is relatively thick, and the paint layer has a signal attenuation of about 10dB, and the wrapped anti-corrosion structure has a signal attenuation of 25dB;
- The lock clamp structure of the unserviced bridge has a large attenuation for the acoustic signal, and each additional level of structure attenuation is about 7dB;
- The knocking signal provided by the 50cm free fall of the screwdriver can be received by the sensor 27 meters away.
5 Noise level test
Acoustic emission technology is a passive receiving method, and there must be external excitation to make the defects "move" before they can be identified. For bridge cables, the main excitation is the quality of the box girder and road pavement, the weight and resonance of vehicles passing by; the main noise sources come from vehicles passing by, wind noise and whistles, rain, snow and hail weather, etc. The usual treatment method is to exclude noise except broken wire signals by setting a threshold value. Combined with the single steel wire breaking and structural attenuation test data, the instantaneous acoustic emission of the broken wire is characterized by high amplitude, high energy and high ringing count, and can be transmitted over a certain distance. It is feasible to do noise testing to determine whether it is feasible to only set a threshold.
By installing the same signal sensors on the root structure and locking clamp of a short cable of about 3 meters in length on a suspension bridge, the response of different positions to the same signal was tested. The data showed that the noise level of the sensor installed on the locking clamp of the 3-meter-long cable was less than 45dB when a vehicle passed by, the signal level received at the bottom of the cable was less than 60dB, and the signal frequency domain distribution was less than 30kHz.
Table 6 Noise test
Sling Locking Clamp Sling root
Sensor location diagram
Threshold 40dB 40dB
Passenger car Amplitude: None Amplitude: 45dB
Large Trucks Amplitude: 44dB Amplitude: 60dB
6 Broken wire monitoring of suspension bridge suspenders
6.1 Brief description of instrument configuration
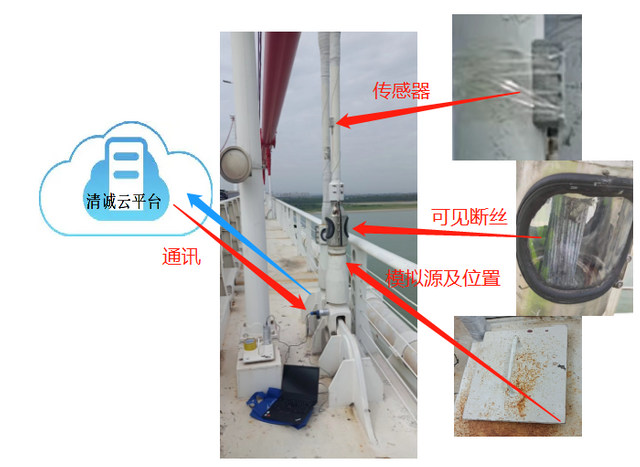
The RAEM1 type broken wire intelligent acoustic wave monitoring system independently developed and produced by Qingcheng Acoustic Emission Research (Guangzhou) Co., Ltd. is selected. This product is an intelligent Internet of Things acoustic wave monitoring system that integrates signal acquisition control, analysis, storage and communication. The site no longer relies on computers based on the Windows operating platform. It has the function of automatic restart when power is off, and can perform unattended automatic data acquisition, storage, analysis and output 24 hours a day. It can be used as a detection instrument, and in-depth analysis can be performed through acoustic emission waveforms and characteristic parameter data. The data can also be uploaded to the designated cloud server as required for function display and alarm rating. On the Qingcheng self-built cloud platform, parameter configuration can be remotely realized, and the real-time and historical change trend charts of acoustic emission data can be viewed. According to the requirements of "JT/T 1037-2022 Highway Bridge Structure Monitoring Technical Specifications", the broken wire alarm conditions and parameter configuration are set. It is a dedicated monitoring of broken wires of suspension bridge suspenders, main cables, cable-stayed bridge cable, and arch bridge suspender (cable) tie rods; its specific functions and parameters of software and hardware are as follows:
Sensor
★ Targeted fitting design
★ Center frequency: 50KHz
★ Frequency range: 40KHz-100KHz;
★ Operating temperature range: -30℃~70℃;
★ Meets the requirements of JT/T 1037-2022 standard;
Figure 11 Broken wire sensor
Collector
★ Independent channel, sampling rate 2M, sampling accuracy 16 bits;
★ Signal input bandwidth 10K-1000KHz;
★ Noise ASL better than 30dB, dynamic range 70dB;
★ Data type: original waveform or filtered waveform, characteristic parameters;
★ Acoustic emission impact parameter data, including arrival time, amplitude, ringing count, energy, rise time, duration, RMS, ASL, energy;
★ Built-in 64G data storage card, which can store the above 3 types of data;
★ Communication method: 4G Internet of Things and WAN port
★ Power supply: external power supply, DC 12V;
★ Working environment temperature -20℃--+60℃;
★ Dimensions φ50X120mm/220X130X80mm
★ The module comes with magnetic
Figure 12 Broken wire intelligent monitoring system
Cloud platform function interface
(a) Remote configuration of collection parameters on the cloud
(b) Wire break alarm setting
(c) Cloud real-time parameters/historical parameters time history diagram
(d) Real-time/historical waveforms on the cloud
(e) Setting the wire break rate function in the cloud
(f) Number and rate of broken wires in the cloud
Figure 11 Qingcheng Cloud Platform Bridge Broken Wire Monitoring System Function
6.2 Pre-installation test
Combined with the visual window installed after the partial demolition of the anti-corrosion layer on site, it was found that some steel wires had been corroded and broken, so the acoustic emission sensor was installed at a certain height above the window to conduct noise testing and simulate broken wire signal identification. The period with large traffic volume was selected as the test window to collect noise signals as much as possible. The sampling mode of the collector was set to threshold trigger, and the threshold was set to 70dB. During the debugging stage, because there was no mains power supply on site, a 12V lithium battery pack was used to power the collector. The acoustic emission timing parameters were configured and data was viewed on the "Qingcheng Cloud Platform" through 4G communication.
Figure 13 Broken wire monitoring test site
The data of static noise and artificial steel block impact simulation wire breaking were collected for about 40 minutes. The trend chart of acoustic emission parameters was checked on the "Qingcheng Cloud Platform". It was found that the noise level could be controlled within 80dB during the period when no artificial impact signal was applied. The 6 signals of 2 sets of steel blocks hitting the root of the rigging had a good correspondence in "amplitude", "energy" and "RMS". (4 consecutive hits at 12:46; 2 consecutive hits at 12:48).
Figure 14 Amplitude history diagram
Figure 15 Energy history diagram
Figure 16 RMS process diagram
6.3 System Hardware Installation
The basic cause of cable wire breakage is the damage of the anti-corrosion layer at the root, which leads to material corrosion and hard damage in the installation link. In the long run, when the load suddenly increases, the stress cannot be released evenly, and the weak steel wire releases energy in the form of instantaneous breaking. The acoustic emission amplitude generated at the moment of release is greater than or close to 100dB. According to the previous signal attenuation test, the anti-corrosion layer or PE sheath attenuates the signal by about 25dB. When the sensor is installed close to the broken wire, the acoustic emission signal is likely to have an amplitude of 100dB.
The anti-corrosion layer or PE sheath can be used as an attenuation medium to attenuate large signals or eliminate background noise signals; adjusting the installation height and structural position of the sensor on the cable can reduce the impact of the bridge deck noise source to a certain extent. Both long-term monitoring of acoustic emission and short-term detection of traditional applications require the investigation and elimination of front-end noise. Acoustic emission sensors are generally installed in contact, and the sensitive end face is generally a white protective sheet or curved surface. However, knocking or hitting the sensor housing will also cause the signal to exceed the threshold and be recorded. When monitoring the acoustic emission of broken wires in bridge cables, it is necessary to protect the sensor housing and cables within a certain range to ensure that external factors such as hail, sand and gravel do not trigger the threshold.
After determining the installation position and height of the sensor, glue is used as a coupling agent and fixing method. During the installation process, try to avoid the presence of particles and concave and convex surfaces. Then, the sensor is tied to the cable with a metal tie. The best effect is to see a certain amount of uniform extrusion on the edge. After the sensor is fixed and connected to the coaxial cable, the sensor sheath needs to be installed. Its significance is to prevent the sensor from receiving external mechanical shock. The basic requirement is that it is installed securely and does not age for a long time. The installation and placement of the collector is still based on the current data security considerations in the industry. The main focus is to first form a local area network and then a single point to the outside. The requirement for the acoustic emission collector is that it must have a LAN port or WIfi networking function.
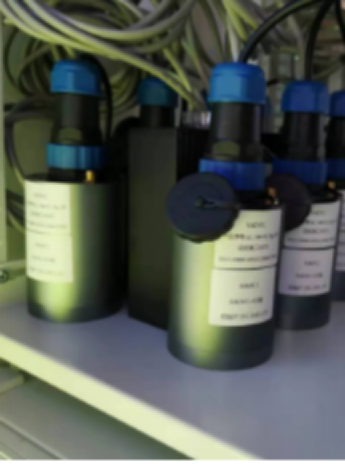
Figure 17 On-site installation diagram of broken wire monitoring system
6.4 Broken wire judgment
For the monitoring of the fracture of a single steel wire inside the cable, the threshold trigger is used as the sampling method. While shielding the noise, the threshold must also ensure that the signal of the broken wire can be captured. The trigger threshold can be set to 70dB or 80dB for the monitoring of broken wires in long highway bridges. When the signal triggers the threshold, the energy, ringing count and RMS in the characteristic parameters are used to make a comprehensive judgment. Under relatively ideal working conditions, one or two of them can be used to judge the broken wire. For example, high amplitude, high energy, and high count are the main forms of characterizing fracture. When the noise of the on-site working conditions is large, the 80dB threshold cannot effectively shield the noise. You can first try to reduce the hardware amplifier multiple to increase the dynamic range of the system. At present, the maximum input voltage range of acoustic emission instruments and general data acquisition cards is generally ±10V. When the commonly used 40dB amplifier is selected, the signal at the moment of the broken wire will be limited and the amplitude difference with the noise cannot be widened. However, while reducing the gain, the signal-to-noise ratio of the signal is also reduced, and the transmission distance is also reduced. When it is impossible to effectively distinguish the broken wire signal by increasing the dynamic range, the amplitude should not be increased blindly. Energy, count, and RMS values can be used to assist in the judgment. If necessary, the proportional correspondence of "amplitude-ASL", "ring count-rise count", "duration-rise time" and so on can be added.
7 Summary
- The break of a single steel wire in the cable is a representation of high amplitude, high energy, and high ring count in the acoustic emission signal;
- The process can be displayed by the amplitude, energy, ring count, and RMS time history diagram;
- The amplitude intensity of the acoustic emission signal at the moment of single steel wire breakage is greater than 100dB; for the monitoring of broken wires at key locations, the trigger threshold can be set to 70 or 80dB;
- The anti-corrosion layer and the sheath are materials that attenuate the sound height by about 25dB. By changing the installation position of the sensor, the road noise source can be avoided to a certain extent;
- The sound attenuation between the lock clamp and the anchor structure is large, and the attenuation is about 7dB for each structural member;
- The signal of a 50cm screwdriver falling freely at 27 meters from the main cable of a newly built but unused bridge to the paint layer can be received by the acoustic emission system as 43dB;
8 Outlook - What is the real acoustic emission signal characterizing the specific situation of cable breakage in an in-service bridge? It is impossible to simulate, and there is currently no literature or experience to refer to;
- There is no universal criterion for determining cable breakage based on acoustic emission, and specific problems must be analyzed specifically;
- Acoustic emission researchers cannot have in-depth access to data due to industry closure or data security;
- Bridge structure health monitoring is an integration of multiple means, and the integration of acoustic emission technology and other means is carried out throughout;
- There is no practical support for the effective monitoring distance of acoustic emission technology for cables of different specifications. How to evolve it?
- The authenticity of the location and number of cable breakage cannot be determined by acoustic emission alone.
References
[1] Ministry of Transport of the People's Republic of China. "JT/T 1037-2022 Technical Specifications for Highway Bridge Structure Inspection". 2022