How to trade GBP after Brexit
The selloff in GBP pairs after Brexit presents a challenge for a trader. At first glance, the strategy for the key GBP pairs, mainly that of the GBP/USD and GBP/JPY, should be simple. The GBP is in vertical short, falling almost in a horizontal line; therefore, the trader should apply a vertical short strategy. But when it comes to the GBP, and for that matter, any pair trading at multi-decade lows, the game plan should be slightly different. So without further ado, here are some tips to trade the GBP after Brexit and any pair that is under its historical lows.

GBP: Two Risks
In the aftermath of the GBP Brexit meltdown, GBP pairs, such as the GBP/USD, have two major risks that we have to navigate around – direction and momentum. Direction – Since we are talking about multi-year lows, we cannot know when the bottom will emerge, because the pair is in uncharted territory. Momentum – Again, we have no way of knowing when the momentum will change from vertical bearish movement to a trend to a possible range bound. So how do we handle those unknowns? We use strategies that minimize the risk from the elements.
Buy on Hammer Reversal
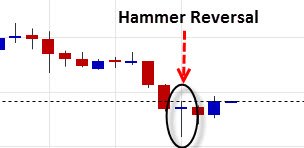
As we can see in the chart below, and as is common when a vertical short occurs, after the vertical short comes a brief bounce. What indicates that that bounce is coming is a hammer reversal candle. A hammer reversal candle is a candle where the middle is long and the opening price and closing price are very close. Once we get a hammer reversal candle we can expect a small bounce. To increase our confidence in an upcoming bounce we can and should combine a MACD indicator. If the MACD indicator suggests weakening momentum, we get a confirmation. Once we get our confirmation it is a signal to buy; our limit should be set below the opening price of the first full bearish candle of the latest vertical short. Why should we use this strategy? When we have no indication as to when the pair will bottom out, it’s hard to take a short without risking a sudden bounce back. Normally, it’s less advisable to trade but, under the current conditions, this pattern gives us a chance to reduce the risk of the unknown and minimize the time we are exposed to a choppy market.
Sell on a Major Pull Back
At some stage, every short, no matter how strong, gets a major pull back. That will be our first real opportunity for a short entry. Once we get a major reversal, and by major I mean at least 38.2% of a Fibonacci retracement, then we will get our opportunity to short. That’s because no bearish trend ends without at least two attempts at the same low. That means that, at such a stage, we are no longer in an unknown and our target is the pair’s lowest point. It’s important to note that when a pair experiences a major retracement it usually signals the end of a vertical short movement and thus is a signal for us to stop using our hammer reversal strategy. Our limit is now known, aka the low of the pair. And our signal to short can be varied, as in trading a short under any other circumstance. Oscillators such as the MACD, Average True Range and the Stochastic Oscillator can help us time the resumption of the bearish momentum and ride the bearish wave. But what’s important to understand here is that after a major retracement, it’s much safer to start trading on a longer term and ride a bearish wave.
In Conclusion
Although those insights have been implemented on the latest meltdown in GBP pairs, the tactics we learned here are not only useful for the GBP but can prepare you for the next FX pair meltdown, whether it’s the Euro pairs or the Brazilian Real pairs. What those tactics teach you is how to trade a rather risky situation with plenty of uncertainty. Sure, it is still risky to trade a currency in a meltdown, but at least, with the tactics above, you can avoid the major pitfalls.
your image is broken
cannot to fix it don't know how to do this