SimpleFX BMW.DE Chart Analysis: July 29, 2022
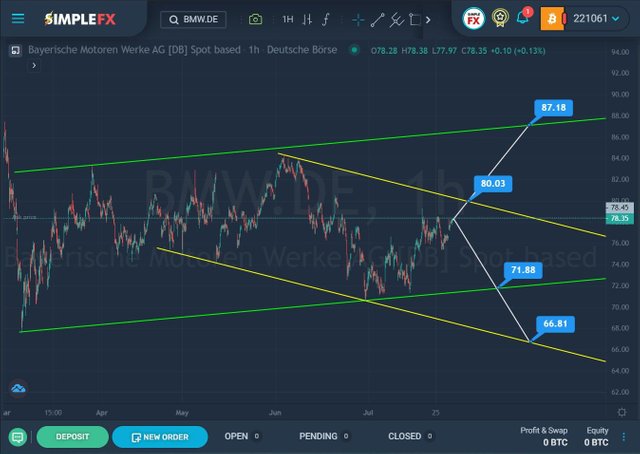
The BMW.DE hourly timeframe shows the formation of a large bullish trend that moves within the green channel.
We see that since the beginning of March, the price, having pushed off from the lower green line, began to gradually move up. After the last attempt of the bulls to touch the upper green line, we saw a market reversal and a downtrend. This section of the chart describes a small yellow channel.
Now the price is near the upper yellow wall. It is possible that the bulls may bring the price to the resistance level of 80.03, which is on it. With a successful breakdown of this level, the price of BMW.DE shares may rise again to the resistance level of 87.18, which is located on the upper green line.
Alternatively, it is expected that the bears will not give up their positions. A bearish trend may form inside the yellow channel in the direction of its lower wall and the support level of 66.81. But first of all, the bears must break through the lower green line and the resistance level of 71.88.
If the bullish movement is confirmed, the opening of long positions can be considered. When confirming a bearish trend, it is recommended to open short positions.