A Timeline of STEEM's Price Decline
Not sure if any conclusions can be drawn, but I think the timeline is interesting. The price peaks on July 19.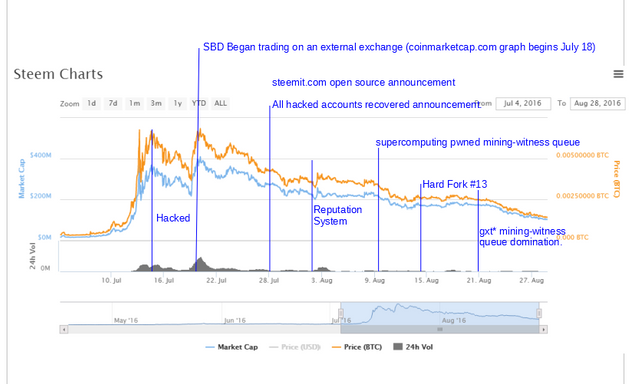
I'm not familiar enough with the exchanges to know exactly what the date implies, but the SBD graph on coinmarketcap.com begins on July 18 and that early peak is on July 19.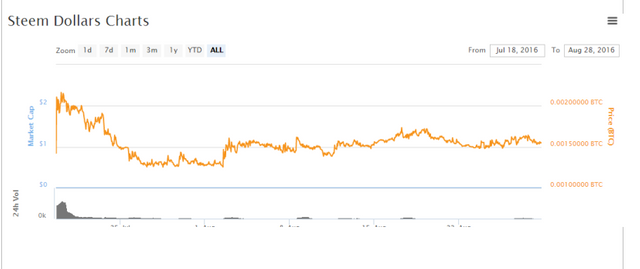
The SBD graph peaked when it was first introduced on poloniex and traders there bought it up before realizing that they wanted to trade STEEM instead. After that it came back down to the ~ $1 mark.
Interesting. Thanks. I think that was just a couple days before I joined steemit. I have been wondering why anyone was ever paying that much for a token that was pegged to a dollar. I guess we all have a learning curve.