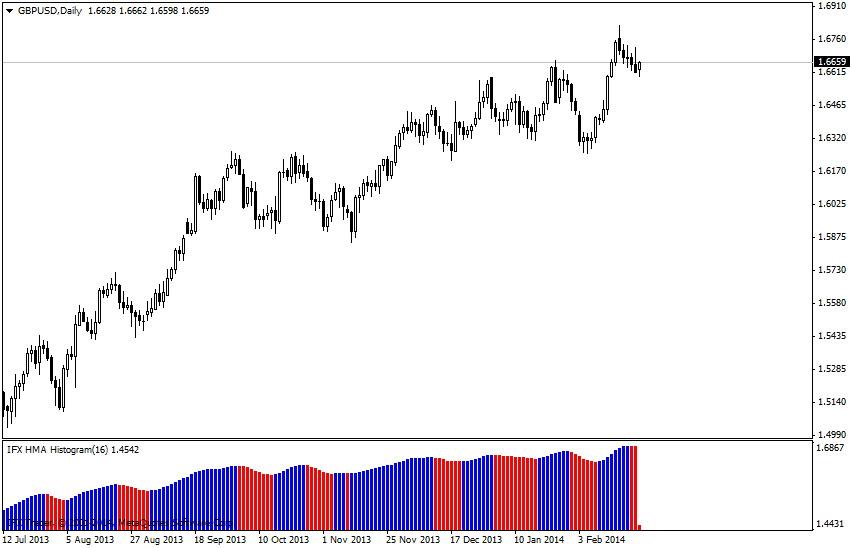
Forex Technical Indicator-HMA-histogram.

Image sources: instaforex.
It is a classified version of HMA Indicator and invented by Mr. Alan Hull.
It is in the form of Histogram and similar to the famous MACD indicator.
If there is a general uptrend in the market and the histogram changed color to the blue from red, it denotes the time to Buy and the overall trend of the market is Bullish.
If it is the reversal of the above, we can consider the time to Sell and the overall trend of the Market is Bearish.
Ref: instaforex.