How to Use Google Analytics - Complete Guide
Today, in this article we are talking about a tool offered by Google so that now every single website that exists around the Internet uses.
This tool is Google Analytics. You may have heard about Google Analytics before.
This allows us to get the full traffic of our website or blog and other analytical information.
It is very easy to connect with your website and you can do so only with your Google account or with the help of a Gmail account.
In this article, I will tell you the features of the deep level of Google Analytics.
If you want to know how to add Google Analytics to your website, please read the post below and then continue with this post as you will get basic information about Google Analytics in the first post which is useful for you Will be
Now I'm going to assume that you have done a lot of good configuration by adding Google Analytics code to your website or blog. Only after doing so can you take advantage of all the features mentioned above along with your website.
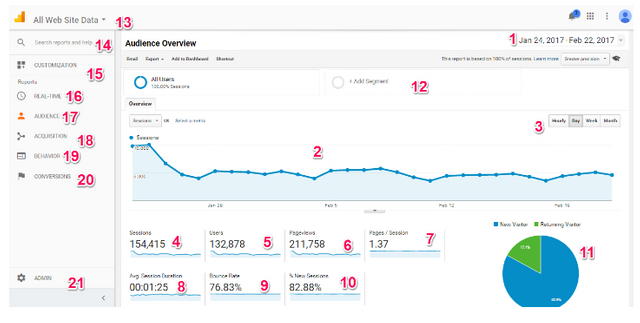
I have a website, which is part 8-9 months old. On this site, I have been configuring Google Analytics from the beginning and have achieved all its analytical data with it today. You can see the screenshot of the add site in my Google Analytics in the screenshot shown below. First of all, a page with Audience> Overview opens, a screenshot of the same is given below.
In this screenshot, I have given different numbers, with the help of which I have explained the features in place of those numbers further in this post.
- Date Range: In this, you can set how much time you want to get analytical data. You can also set a range of custom dates such as data from 25 March 2015 to 23 Feb 2017 or last 7 days, data from last 30 days etc.
- Stats Graph: In this, you get a graph of any of your analytical term such as PageViews, Number of Users, Sessions etc. (Time Vs Number Graph)
- Graph Plot Range: In this option, you can set the minimum range value of every single point in the graph such as one day, one week, one month or one hour.
- Sessions: Here is the number of sessions shown in the selected date range of your website. At one time, any user comes into your site and regardless of how many pages open, at one time, use is considered a session.
- Users: This number is the number of unique users who visit your website in your selected date range. One user can also have multiple sessions. In the screenshot shown above, you can see that Number of Sessions is more than Number of Users.
- Pageviews: Pageviews is the number of pages total of your website is open. There is a page view count in it. There may be multiple page views in one session. So you can see in the screenshot shown above that the number of page views, number of sessions and number of users is much higher than both.
- 7.Pages / Session: The number of pages that a user opens a session is displayed in Pages / Session here.
- 8. Average Session Duration: How much time a people spend on your site during a session, is used in the average session duration used. Remember all these values
are average and calculate according to the average. If a user wants to leave your website in 10 seconds, then leave it after 1 hour. Then calculates with the average value calculation.
- 9.Bounce Rate: This is an understanding thing and how much interest do readers show in your website or say your website's management level is an important factor. It is a percentage of those users Dikyi, which come on any page of your website, whether it's homepage or even any other post or page and made a visit to any other page of your website back on another website or Go away. In other words, this is the percentage of single page view sessions that occur on your website.
- 10.Percentage of New Sessions: This is the percentage of Completely New Sessions displayed on your website. That is, people coming in this percentage belong to a category that has never visited your site before and they visit your website for the first time. Returning Visitors are visitors who have visited your website before and used to visit again.
- 11. New Visitors Vs Returning Visitors Graph: This graph shows the percentage ratio of sessions for New Sessions and Returning Visitors. According to the screenshot shown above, my New Sessions has 82.9% in the last 30 days and the remaining 17.1% are returning sessions.
- 12.Segment Add Option: All data explained above are showing within a segment, whose name is All Users, you can add more such segments to this option and customize them according to your own accord.
- 13.Website Selection: If you have added Google Analytics to multiple websites from your single Google Account, then you can switch between different options with these options.
- 14.Search Reports and Help: You can quickly search different reports or Google Analytics Help articles.
- 15.Customization Menu: By using this menu, you can make customizations of multiple types of data associated with your Google Analytics.
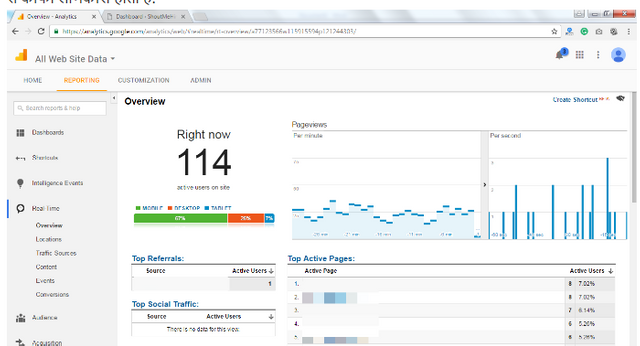
- 16.Real-time Reports: This is also my favorite feature of Google Analytics and many others, in which analytical data of existing visitors is obtained on your website. In it you can see how many people are at your website at this time, what is the URL of which city or village they are viewing your website and what page has been opened. This information is very useful for you from different aspects.
- 17.Audience Reports: The above screenshot comes in the Audience Reports only, it is an overview of this report, which contains your audience's world data.
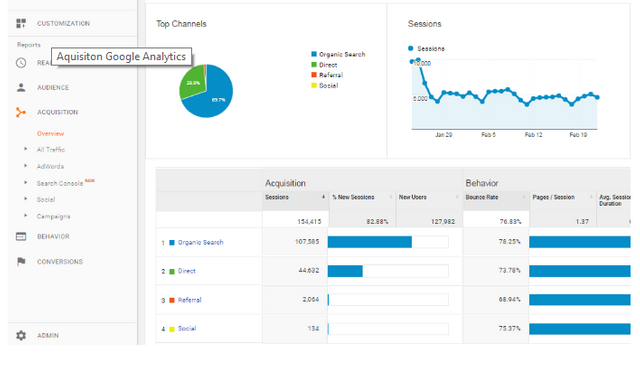
- 18.Acquisition Reports: In these reports, you can find out which resources you get from traffic and how much traffic you are getting.
- 19. Behavior Reports: In these reports, you can shake your audience's behavior, such as what people like and do not like most on your website.
- 20.Conversions Reports: If you set up some goals in Google Analytics or want to track conversions for affiliate sales, then this feature comes in at rough level.
- 21.Administrator Options: In this, you can use all your admin features such as changing major site details or getting tracking code etc.
In addition, Google Analytics has many features that you can explore yourself. I have briefly explained some of the features such as Behavior Reports. If you see yourself, you will get multiple sub-options in this option, from which you can shake your own information. Whatever the options everyone should know about the blogger, I have already explained it above. If you understand these features then you will understand everything else.


