Cryptocurrency analysis and predictions using AI and big data
The world of the blockchain technology is rapidly transforming our digital space, and it will not take long before it manifests into the physical realm at large scale.
The future of cryptocurrencies:
There is a huge debate among powerful people and everyone has their own opinion. Some say cryptocurrencies are just a bubble that will explode and fade away, while others see it as a replacement for our entire monetary system. The reality is that bitcoin will not disappear any time soon, definitely not overnight.

My findings:
In 2017 I have put a lot of thought in developing a system that could help me analyze the value of cryptocurrencies (Bitcoin; BTC) in particular. Unfortunately there are not many resources out there (at least not for free) which can make serious predictions. Most are just "dumb" statistical extrapolations used for marketing purposes (trying to sell you some guide, book or a service).
About a week ago I finally set out on a journey to realize such a system. As I have been working day and night on it, I have made great progress and found a lot of interesting information. In this thread I will be posting my findings and opinions. You may use this information to make decisions but don't be reckless.
The strategy
I have been talking to quite some people who are actively trading cryptos. I realized their decisions are not primarily based on the price of a certain coin/token, but they follow the trends (social media, news, forums, ...).
We all know that trading is all about supply & demand: crypto is in a very "baby" phase compared to Wall Street and everything related. It is hard to predict how Coca Cola's stock price will behave, but with crypto it is simpler. Let me briefly explain why. I think we can all agree that +99% of the people who buy/sell bitcoins have the following:
Access to the internet
Have at least one social media profile
Are daily active on social media in some way
Read forums, blogs and news sites
Rarely watch TV compared to 10 years ago.
So their decisions must be based on "whatever" is happening on the internet. The reason they/you bought something is because you did your research and found out that coin "XYZ" is a worthwhile investment; so you read information somewhere about "XYZ", your action of "buying/selling XYZ" had an impact on its price (just a very small one).
In this thread I will regularly write updates about my strategy and keep you updated on my findings. I also invite fellow developers and data experts to contribute :)
Framework
Wednesday 27, 2017
I started developing a set of tools that would allow me to track, monitor and record everything about a specific coin, I chose Bitcoin (BTC) for simplicity since it's the biggest and causes most hype worldwide.
The idea is to gather everything I can about Bitcoin, everything from social channels (Twitter, Reddit, Facebook, ...) and all articles found on various news sites (CNN, CNBC, BBC, ...) and blogs/forums.
Once I had some data I would put it on a chart so I would had a graphical representation.
Since I have been a developer/programmer for almost a decade I could pretty easily put all the pieces together. Thanks to Python and MySQL I put together a basic prototype. While my system was gathering data, I was working on making a basic interface (a simple graph using ChartJS open source software). A several hours later I already found something remarkable:
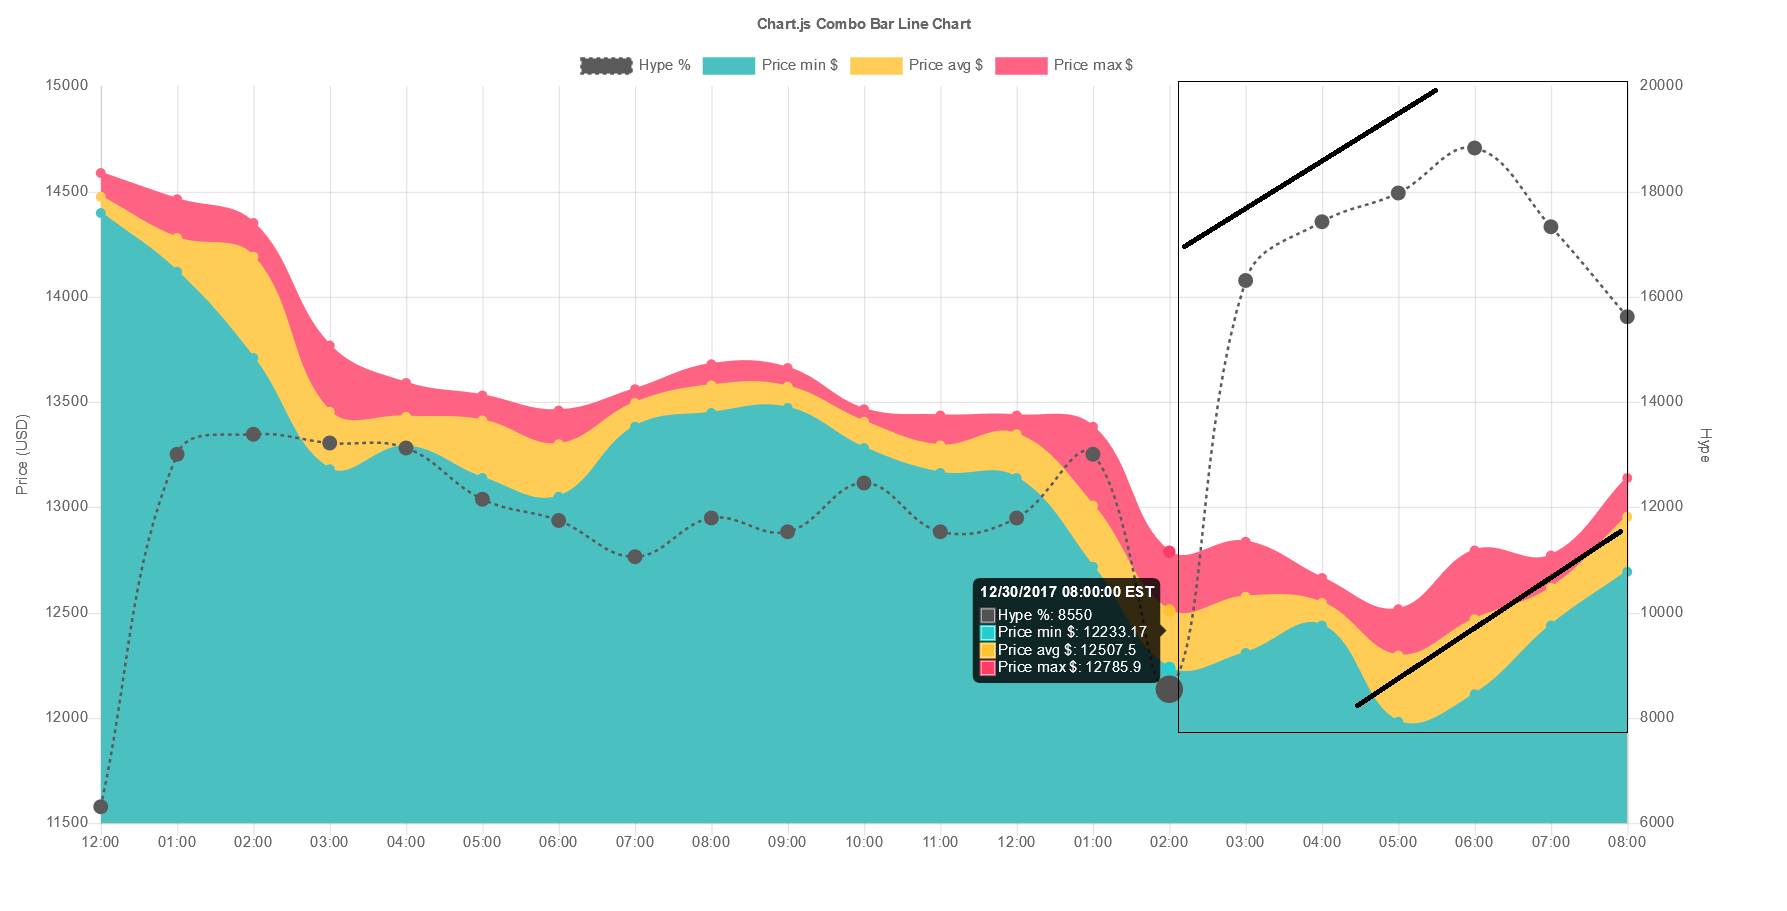
Let me briefly explain this graph:
The left Y-axis is the price of BTC (obtained from https://www.bitstamp.net/)
The right Y-axis is the "hype". In this case it is the total number of social media mentions related to Bitcoin.
The X-axis is an hourly time line.
The data is aggregated by the hour, this means that data generated between [01:00, 02:00] is shown under 01:00. And the same is true for every X-value, including the last one 08:00 means data for the period of [08:00, 09:00]. It's important to keep this decision/notation in mind. I may change this in the future but for now it's good enough.
- On the chart's legend you can see that the blue/yellow/red graphs are the prices of BTC (min, avg and max) during a certain period (e.g. between 03:00 and 04:00). [left Y-axis]
- The dotted line is my "hype", it is the sum of all mentions during a certain period [right Y-axis].
You may realize that this graph has two Y-axes and their data is completely unrelated to each other.
However I found something interesting! Using Paint I drew a black box to indicate an interesting region. And I also drew two black lines to indicate the slope for both sets of data. It appeared to me that they are somewhat related after all. This means that "hype" (from social media/news) could be related to the price of BTC.
Also note that the "hype" goes up before the price goes up. Maybe we can use this to predict the near-future? Let's find out soon.
Thursday 28 - Friday 29, 2017
To verify whether my findings are right or wrong, I had to accumulate more data.
But it was not an easy task, as I started gathering more data I noticed it was getting very "intensive" for my server -- there was A LOT of data so I had to re-design my super basic scraper and use something special for big data. In addition to using plain Python and PHP, I had to incorporate Apache Spark and Apache Kafka for processing the data. Right now I am storing it in a MongoDB database.
And since it's already 2am in Belgium ...

Your Post Has Been Featured on @Resteemable!
Feature any Steemit post using resteemit.com!
How It Works:
1. Take Any Steemit URL
2. Erase
https://3. Type
reGet Featured Instantly � Featured Posts are voted every 2.4hrs
Join the Curation Team Here | Vote Resteemable for Witness