How do bullish and bearish candlesticks work?
Introduction
Making the right decisions in trading depends on our knowledge. To my thinking, you can't invest in the virtual market thinking only on luck and chance, let's remember that we are working with money and capital risk is not something to be assumed simply.
Tracking the market on a certain timeline will define the amount of crypto we can earn, therefore, the return on investment is going to be linked to our ability to take advantage of the bullish season for the strategic buying and selling of securities.
There are a number of tools offered by financial services platforms which support us to venture into crypto trading, as long as we manage them properly.

Study the market
The volume of digital assets determines the amount of cryptocurrency traded in the market, the value of the same can fluctuate unexpectedly; according to my own opinion, the understanding of flow charts, market indicators, the amount of orders processed in a given Exchange, crypto news and other statistical data have a predictive nature, which speaks of the reality of the cryptocurrency we want to trade.
Challenges for the Trader
Long-term investments are usually the safest, since the trader has the opportunity to track the history of a crypto asset in detail and manage uptrends and downtrends to invest in. The true potential of a trade will be seen based on results; profits can be made daily, in a few hours, in several weeks or perhaps months. However, a well prepared trader develops the ability to make timely decisions at the right time.
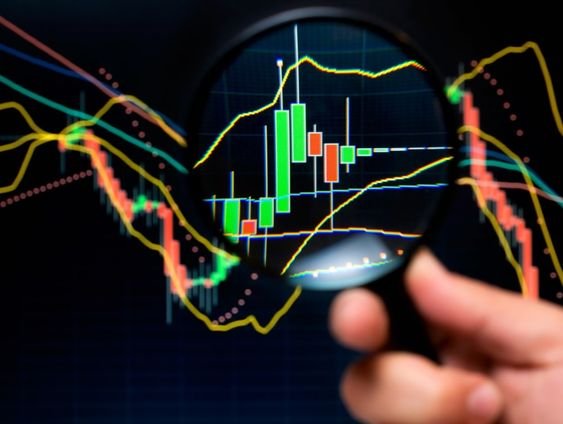
Bullish and Bearish Japanese Candlesticks
They are a statistical charting tool which identifies the ups and downs of the market for a given crypto. The reading of the diagram serves as a guide to buy or sell in real time handling technical aspects, complex and 100% reliable.
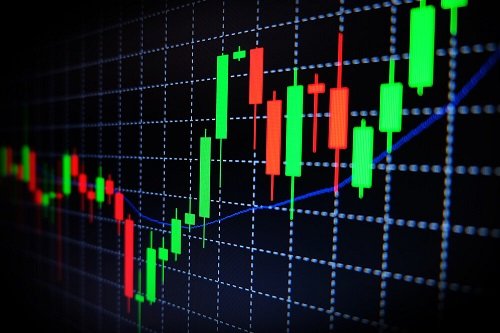
Green Candle:
Light candle or green candle, indicates the uptrend in a given time frame, profits can be generated by buying crypto while the candle reaches its highest point or "resistance". The reading can be programmed in short time frames for instant decision making, but there are also long time frames for more calculating traders who rely on tracking before proceeding to buy.
Red Candle:
The dark candle or red candle indicates a bearish period. In this period, sell before the currency loses a lot of value and reaches its lowest point of decline or "support". It is not possible to think of buying during the downtrend because it would generate losses, however, according to the study, the long term trader determines which will be the support or new beginning of the uptrend to plan a possible purchase.
Parts of a Japanese Candlestick
A Japanese candlestick chart shows the market values, highs and lows, reached by the cryptocurrency, as well as, the opening and closing points. The market activity is given by the human condition of users who trade spot securities and usually refers to repetitive behaviors that define a predictable timeline. Japanese candlesticks are set up to record trading activity for 24 continuous hours and charts can be found on any trading platform.

What is Support and Resistance?
We must know the precise meaning indicated by candlesticks to buy or sell with absolute confidence. When we make the study of the Candlestick diagram there are broad aspects to be taken into account:
Buy-Sell Zones
- The buy zone is determined by the ascending period from the last support to the maximum level of positive fluctuation indicated by the resistance. It is determined by a green candlestick.
- The sell zone is considered to be the period when the value of the cryptocurrency is going to fall, therefore holding on to it would not be advisable as it would generate capital losses. After reaching the last resistance, the trader studies the market behavior based on the history, pointing out the repetitive patterns that help him to determine the exact moment to make a sale. It is determined by a red candlestick.
Support

Image created by the author
The point where the crypto stops its bearish behavior and starts a bullish behavior, according to this reading of the diagram it is recommended to buy as it will be the most reasonable price according to the competitiveness of the market.
In other words, it is the beginning of a bullish period that is expected to last long enough to buy and make safe profits.
Importance of Support
It is important to study well the chart to detect the exact point in the history of the currency where it began the last "Sustained Ascent" (Bullish), after evaluating for a short period of time to determine that the cryptocurrency repeats the previous behavior, you will be convinced that it is a point of Support.

Diagram Analysis: The Candlestick chart shows four points of Support on the time line taken as a reference, during a 28-day tracking these coincidences were observed where the trader can proceed to "Buy" (Long-term Trader, duration 1 month).
Resistance

Image created by the author
The Resistance reflected by the chart corresponds to a point where the behavior of the Cryptocurrency will be diametrically opposite to the Support. After an uptrend, we find an inflection point where the currency will fall steadily.
Resistance is the recommended value to sell, since from there the market competitiveness will be created to reach an average value that will be accepted for sale.
Importance of Resistance
It is important to determine the real culmination of the rise, since a misleading reading could lead to an interruption of the investment in progress. A ceiling value can be predicted through study, as a repetitive behavior on the time line. Since the value of the currency is falling it is not recommended to buy until it hits a bottom value, which, could represent the consecutive Support and new upward cycle.

Diagram Analysis: The Candlestick chart shows three Resistance points on the time line taken as a reference, during a 10-day tracking the patterns were observed where the trader can proceed to "Sell" (Short-term Trader, duration 10 days ).
Final thoughts
A patient attitude, when dealing with crypto assets is an advantage when you want to be financially successful. To elaborate a buy order is something that many of us want to do but it is preferable not to be dominated by the impulse, since it is better to secure the investment through technical analysis. We have, that the long term trader risks less his capital, is more calculating and patient. Let us remember that the Japanese candlestick diagrams are a reliable reading that allows the prediction of the stock market behavior.

Diagram Analysis: "The support and resistance chart has been explained in detail in the previous section. It should be noted that it defines an ascending and descending line in the form of a "Wave" and for this occasion it is shown as follows. The background image shows the green and red Japanese candles in "Watermark" mode. The graph results by superimposing the two previous studies and joining the points of purchase and sale."
The uptrend, associated with the purchase, is given in a specific timeline, which makes trading a cyclical process which will always end in a new downtrend, waiting for the chart to reach the support and resistance points, is a basic task that we all must learn when entering the virtual stock exchange.
Original Content
2021
It's nice to meet you, here is my new presentation on Hive.blog: IntroduceYourself