DECA Price Mechanism, Part III: DECA Token price determination
.jpg)
IMPORTANT NOTE: This is only for educational purposes, we do not promote investment or that what we explain here is a pure fact.
The objective of this section is to define the methodology to establish the price mechanism of a semi-stable coin. The token has a backup resulting from an Initial Coin Offering and gradually uses this to append a commodity which, in this case, are carbon credits.
Taking the original Fisher Equation M x V = P x Y, we define the terms as follows:
• Money Supply (M)represents the Ether's raised in the ICO and the carbon credits bought and cancelled before and after the ICO expressed in Ether.
• Velocity is how many times the token is changing hands or rather DECA wallets. It is static in the DECA token model as our token cannot be sold on an exchange.
• The Output (P x Y) represents the DECA Token price expressed in the value of Ether and the carbon credits cancelled expressed in the value of Ether multiplied with the quantity of DECA Total Supply.
The following terms are defined in order to get an easier understanding of the base variable of our model:
CCTS: which stands for Carbon Credits Total Supply.
ETHTS: which stands for Ether Total Supply.
DTS: which stands for DECA Total Supply and where DECA is the name of our token. This includes the token printed and the floating factor.
PPD (ETH): which stands for Price per DECA expressed in Ether.
CCTS and ETHTS are equal to the money supply M whereas DTS is equal to the quantity output Y in equation (2.1)
There are two methodologies to establish the DECA price mechanism. First, the relation between the before mentioned variables will be analyzed, and the price formula will be established. In the second methodology, we take the before mentioned variables and apply them to the Fisher-Equation.
3.1 Semistable Price Mechanism
Based on the first defined variables, the way to relate them regarding how most of ICO's currently work are these basic relations:
Relation between CCTS and DTS which we define as RCD:

Relation between ETHTS and DTS which we define as RED:

Relation between CCTS and ETHTS which we define as RCE:


Regarding the basic relation equations, we can consider that (3.1) and (3.2) are obvious mathematical components that represent our hybrid (semistable) cryptocurrency-based assets. Based on that mathematical fact, we define our (3.4) equation:

3.2 Quantitative Money Supply Approach (THE DECA PRICE APPROACH)
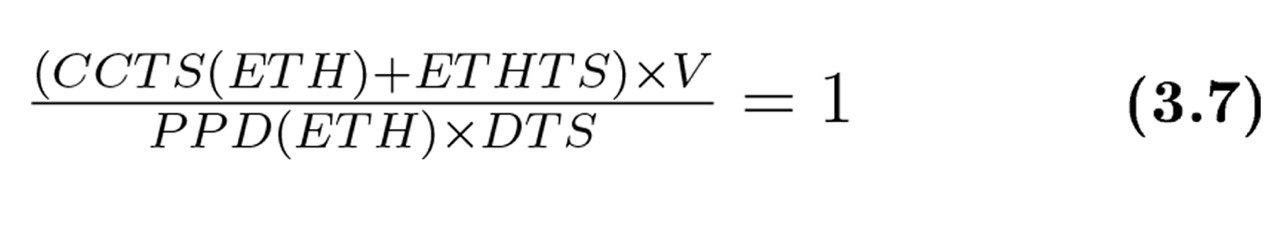
The quantitative money supply or Fisher - Equation (2.1) adapted to the DECA Project is as follows:

The left part of the equation gives us the total investment in Ether (Also known as Ether Total Supply or ETHTS) at the promotion week, which is raised during the ICO and the expense to purchase carbon credits before the ICO expressed in Ether.
The right part of the equation represents the Price per DECA Token times the DECA Total Supply, which has been printed during the ICO as a consequence of the Ether investment. Based on these mathematical facts, we can recast the equation (3.5) in order to get the Price per DECA which might follow the next mathematical fact in ether units:

3.3 Equation testing
Since our model is based on the mathematical relation between equations (3.1) and (3.2) (base components), we will consider CCTS and ETHTS as our base mathematical factors (components) that have a straight relation with the DTS. Based on that mathematical fact equaling this relation with a unitary price, we reach the next definition:
Considering:

and by substituting their values from the first cell we get to:

The equation (3.5) can be conducted as:
4 DECA Token Price Model: Data Analytics
In this section, we apply the equation and assumptions from section 3 to establish a DECA Token price model.
DECA’S Ether Total Supply Minimum Goal
which is: 70 000 Ether
NOTE: That even if it’s for educational purposes, we have considered the legal issues and assumptions matching North American securities regulations. This provides an additional level of security to DECA partners.
We consider two date frames:
• ICO: 01 of July to 15 of September 2020 *
• Post ICO: 16 of September 2020 to 16 of September 2023
*The final ICO date might vary around 15 days as it is still in revision.
In the pre-ICO phase, DECA already invested in and canceled carbon credits. Image 2 shows the investment goal and the percentage of carbon credit backup.

Image 2. Carbon Credit Backup before ICO, Source: Own Development.
Other important considerations which only apply in DECA's Smart Contract Design and model assumptions are:
DECA ICO promotion dates
| PROMO | TIME (WEEKS) | DECA TOKENS PER ETH |
|---|---|---|
| pre-ICO | 1 | 300 |
| Bonus1 | 2 | 275 |
| Bonus2 | 3 | 250 |
| ICO | 5 | 225 |
NOTE: Consider 2.5% of the DECA Token Market Capital that goes to
the contract owner. This is considered in the DECA Total Supply (DTS.) and
applies to all Models.

Table 1. Data set ICO, Source: Own Development
Table 1 shows a data set that simulates the ICO from July 1st to September 15th, 2020, with a constant Ether investment quantity per day (910 Ether) to reach the 70 000 Ether by the end of the ICO. Furthermore, it reveals the accumulated Ether Total Supply (ETHTS) and the carbon credit backup (CCTS) in Ether during the ICO, which is constant at 106.61 Ether. The simulation does not consider the promotion in weeks, but the Total DECAs per Day includes the DECA´s emitted per Ether and the floating factor of 2.5%.
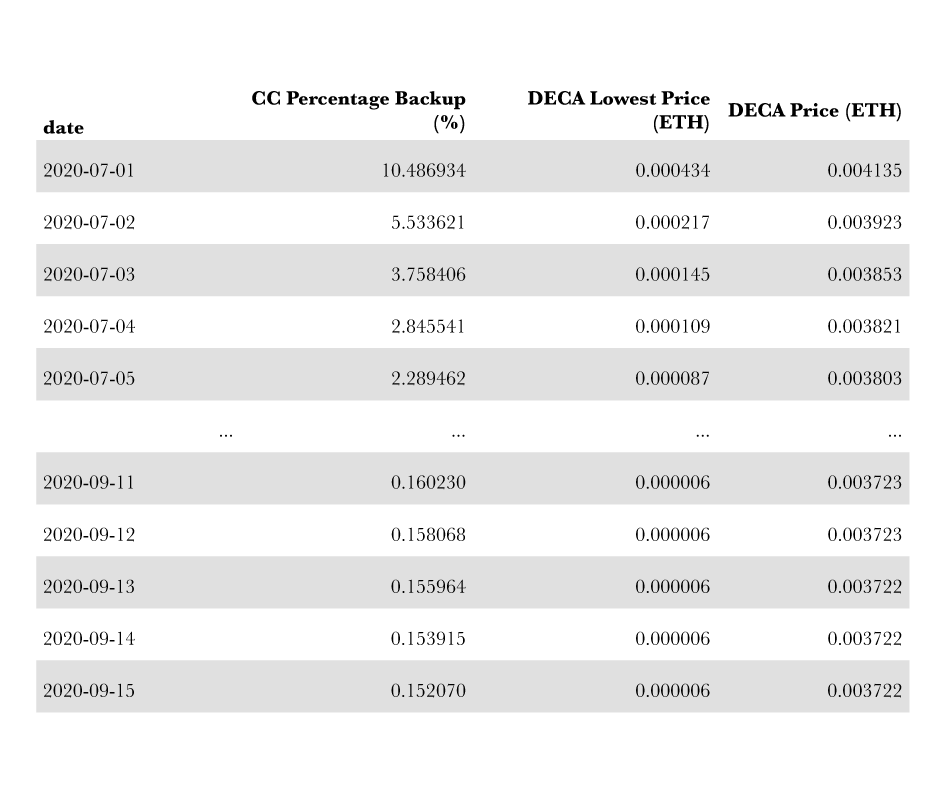
Table 2. DECAPrice(ETH) in ICO, Source: Own Development
Table 2 shows the carbon credit backup in percentage, the DECA lowest price equation (3.3), and the DECA price from equations (3.4) & (3.6), which are expressed in Ether units. As the DECA project developer purchased and canceled carbon credits before the ICO launch, the DECA token simulation model starts with a backup of 10.48% at a fixed daily investment of 910 Ether, which decreases constantly until reaching 0.15% by the end of the ICO. The DECA lowest price reveals the price that the DECA Token cannot drop below due to its semi-stable characteristic. The reason is that the carbon credit backup is decreasing if Ether investment is increasing. The DECA project developer will buy the quantity of carbon credits after the ICO to reach a backup of 5%, which will lift the percentage backup to 5% and the DECA lowest price.
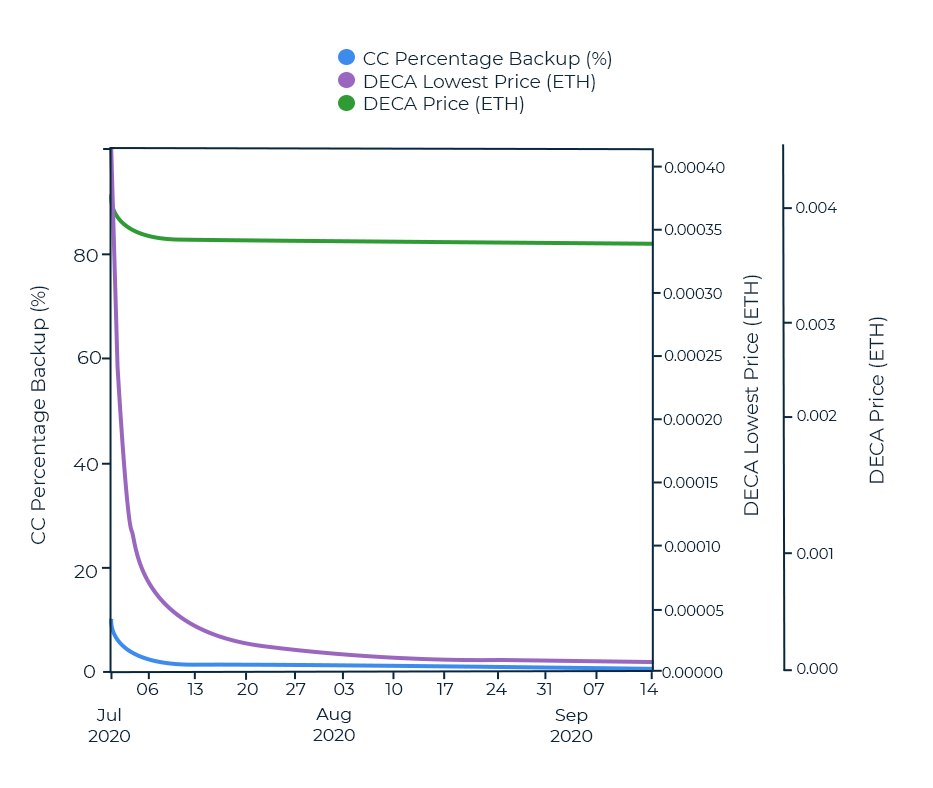
Image 3. DECA Token Price Development ICO, Source: Own Development
Image 3 shows the same data set as a diagram where axis y1 is the carbon credit percentage backup, axis y2 is the DECA lowest price equation (3.3), and axis y3 is the DECA Token Price expressed in Ether equations (3.4) and (3.6) during the ICO. The slope of all curves is negative to the CC Percentage Backup, which means that a linear relationship exists. The DECA Price (Ether) drops 89.25% compared to the starting price, but the DECA lowest price results with only a minimum Percentage(%) change.

Table 3. DECA Token Post ICO, Own Development
Table 3 shows the DECA Token price development with and after the ICO, 77 days plus 3 years. As the ICO ends, the smart contract is not able to print new DECA's, and the DECA total supply remains constant (column 1). The CCTS(ETH), which represents the carbon credit backup in Ether, increases from 106 to 14,106 as DECA increases the Carbon Credits (CC) Percentage Backup by 5% gradually until it reaches 20% at certain dates in order to give the DECA Token a stronger backup. Consequently, the DECA's lowest price increases to 0.000749 (ETH) at a backup of 20%.

Image 4. DECA Token Price Development Post-ICO, Source: Own Development
As Image 4 shows, after the ICO, the DECA Token price (y1) expressed in Ether will remain the same until DECA Currency is developed. The DECA lowest price (y2) will increase gradually due to the incremental carbon credit backup (y3) from 5% to 20%.