Bull signals on the market indicate a possible price surge. Technical Analysis
We present you the translation of the article on the Bitcoin analysis of the market from the analyst Omkar Godbole. In the article, he gives his forecast of the development of the situation in the crypto currency market: BTC is still in a tapering price range, but may soon rise above $ 8,000 if bulls can push the price above the resistance level of the 50-week moving average.
At the time of writing the article on Bitfinex, the crypto currency is trading at 7,770 dollars. The BTC is stuck in the narrowing price range (pennant), which has been forming for several months.
Bulls rebuffed at around $ 7,000 last week. The subsequent growth was 9.3% against the last week's minimum of $ 7,040. All this canceled the immediate bearish outlook and forced investors to talk about a possible rally to the level of resistance of the pennant at the level of 8,870 dollars.
Although at the moment this goal may seem hazy (and somewhat contrived), it can become relevant if Bitcoin confidently overcomes the key resistance level of the 50-week moving average (MA) to begin with (currently $ 7,819).
Weekly chart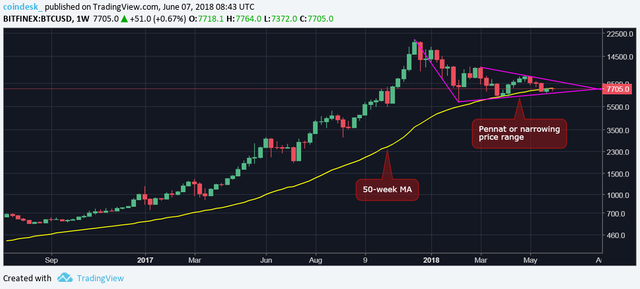
As can be seen from the above chart, last week the BTC avoided a downward (bearish) break of the tapering price range, having rebounded from the mark of 7 040 dollars. This downward breakdown would mean a resumption of the sale from a record high of $ 19,891 and, perhaps, would lower the BTC price below $ 6,000 (the February minimum).
However, the surge from the low last week ($ 7,040) neutralized this threat. It is still too early to say that Bitcoin is now targeting $ 8,880 (pennant resistance), but the likelihood of this will increase significantly if we see aggressive movement above the key resistance level of the 50-week MA.
This step will lead to the cancellation of the long-term bearish reversal, which was indicated by the weekly closing below the moving average in the third week of May. Movement above the 50-week moving average (MA) should also be supported by a steady increase in trade volumes. This will help Bitcoin break out of the pennant.
On the daily chart, Bitcoin is set for a convincing break above the resistance of the 50-week moving average.
Daily chart The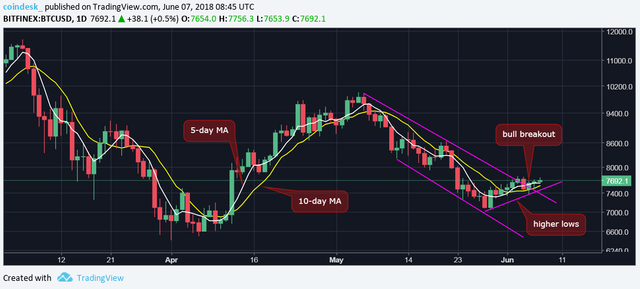
bullish breakout of the downward price channel, fixed earlier this week, indicates a short-term change in the market trend (with bearish on the bull). The 5-day moving average (MA) and the 10-day moving average (MA) also favor bulls. The same can be said about a pattern with higher minima formed.
Thus, a break above the current level of resistance at 7,780 dollars (maximum on June 3) can lead to a swift rally to
8,000 dollars. This movement will also add confidence in the theory of the "6th of the month", which hinted at a bullish reversal.
The outlook for the future of the
BTC could grow to $ 8,000 over the next 24 hours (or so) if it can break through the resistance at $ 7,780.
It seems that this week BTC is ready to close (closing on Sunday on UTC) above the 50-week moving average (MA) (at the moment - 7,819 dollars). In this case, the probability that the BTC will move further to the resistance of the pennant (8,880 dollars), will increase dramatically.
Bearish scenario: The BTC may fall to the support level of the pennant
($ 7,080) if the bulls can not take advantage of the favorable situation (as evidenced by the daily chart), and the price will fall below $ 7,372 (at least on June 5).
Weekly closing below $ 7,080 (a downward breakout of the pennant) could lead to asset sales and a price drop below $ 6,000 (the February minimum).