Burned tokens, rewards, and inflation summary September 2, 2023: 235K SP, 159K STEEM, and 1,146 SBD burned in 73K burnsteem25 posts
Steemit launched the #burnsteem25 initiative on May 22, 2022 and the corresponding rewards started being delivered to @null on May 29. Here is the next weekly update with PowerBI charts to visualize the burned token-related statistics since those dates.
Attention: This post does not have the customary @penny4thoughts beneficiary setting due to ongoing issues with Steem API usability.
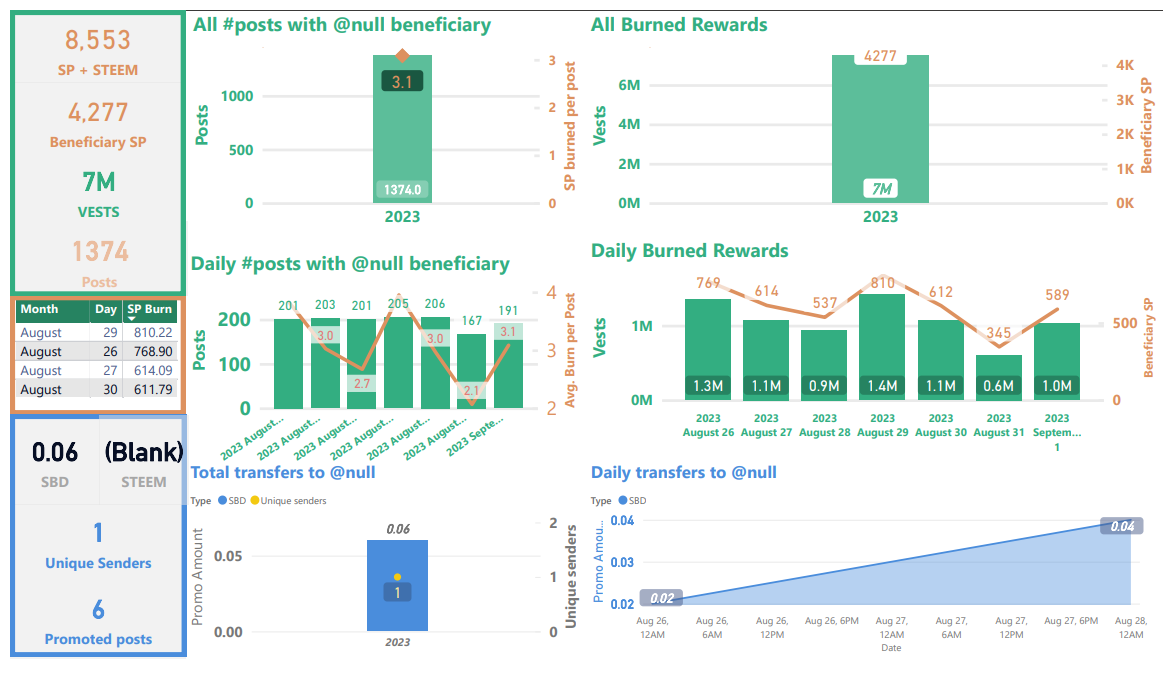
Slide 1 & 2: Burn amounts in beneficiary rewards and transfers to @null. (Weekly & All time)
According to data from steemdb, weekly totals were about 4,277 SP in burned beneficiary rewards and 0.06 SBD burned on promotion with 1,374 burnsteem25 posts (~3.1 SP burned per post).
The numbers in these slides will differ slightly from the numbers in slides 5 & 7 because of different data sources and collection times. The numbers in slide 2 are artificially low due to some missing information in SteemDB from March 7 through March 14.
This week's numbers were influenced by some sort of issue with the Steem API, hivemind, and/or the Steemit web site. The issue began on Wednesday. It improved after a day and a half or so, but still does not seem to be fully resolved.
Weekly
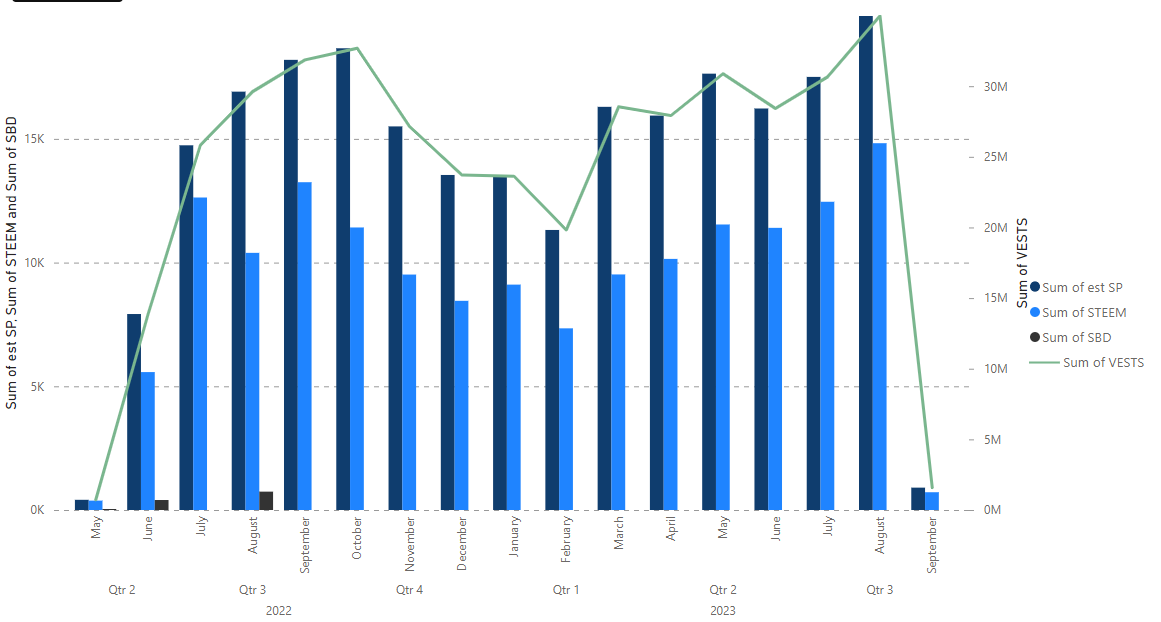
May 29, 2022 to present (burnsteem25 era)
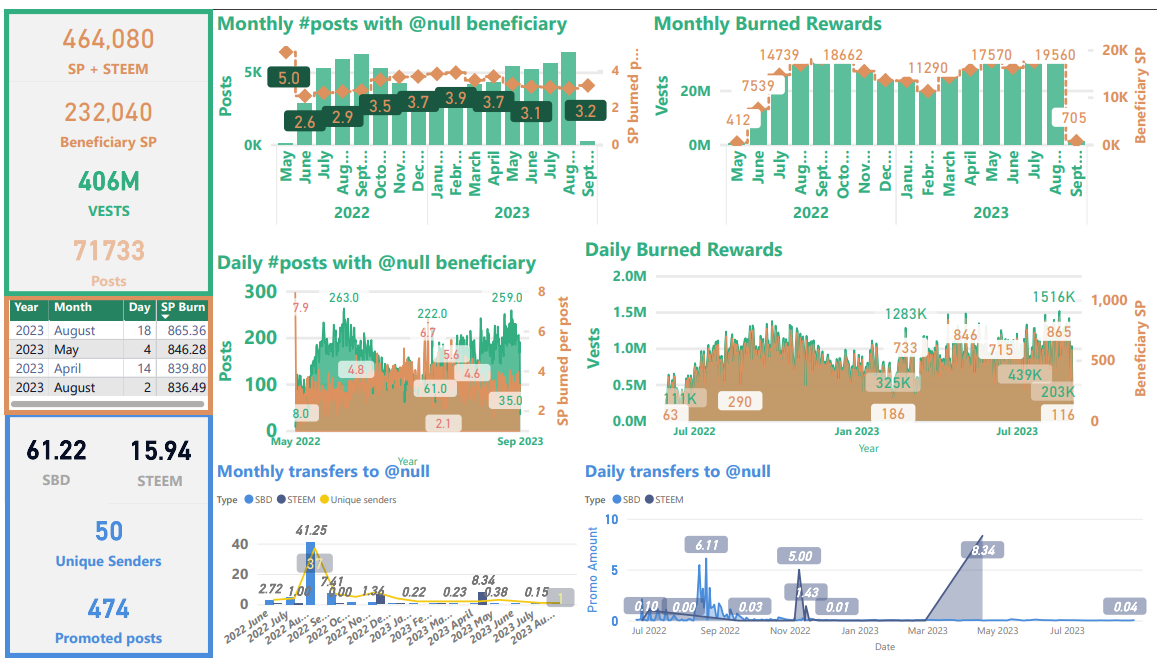
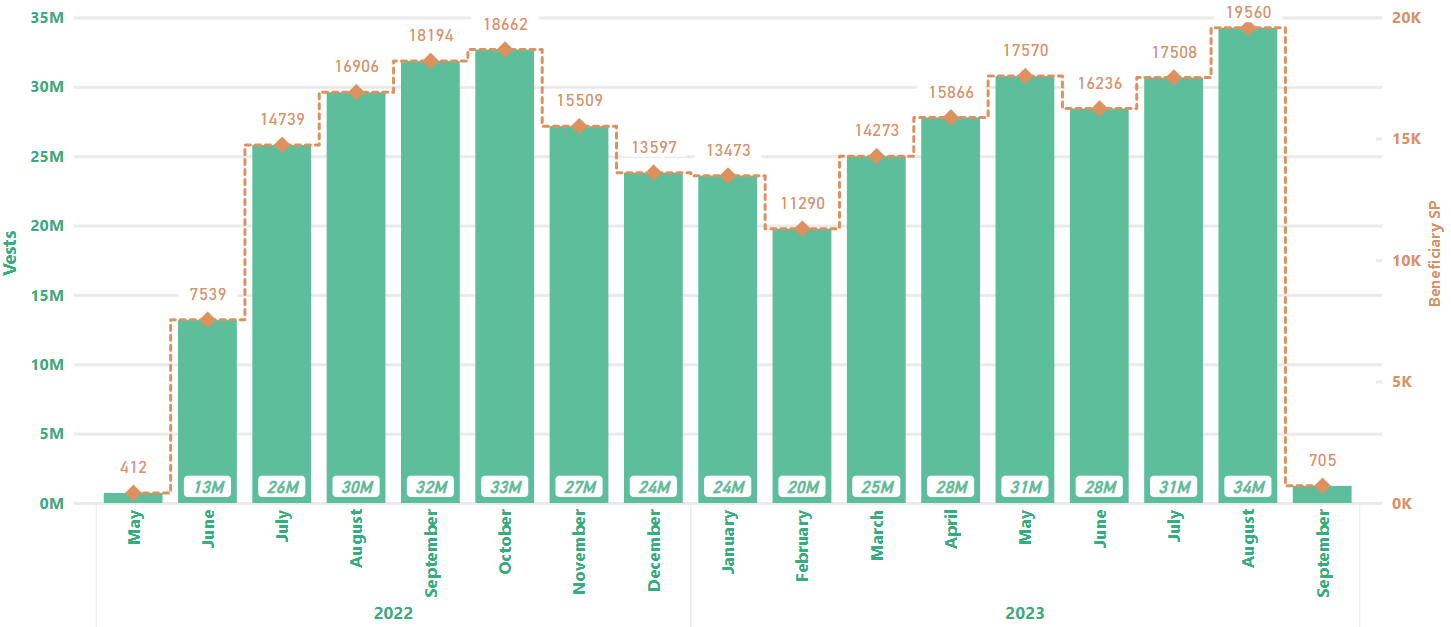
As seen below, August, 2023 was the highest month since the beginning of the #burnsteem25 initiative.
| Sidebars |
|---|
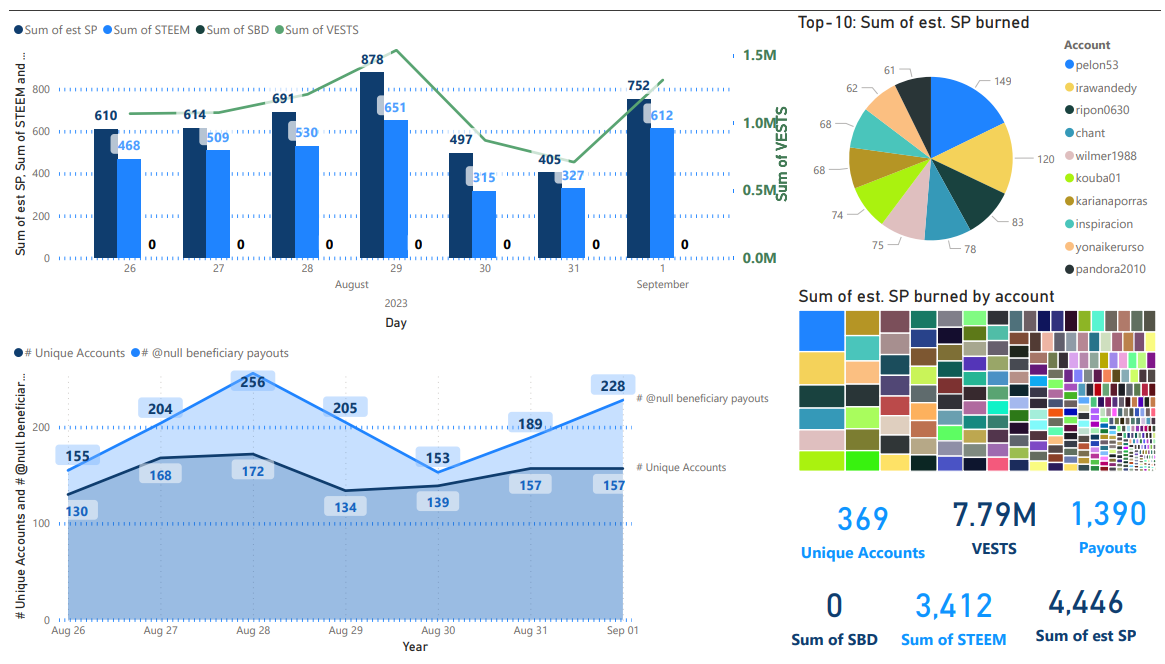
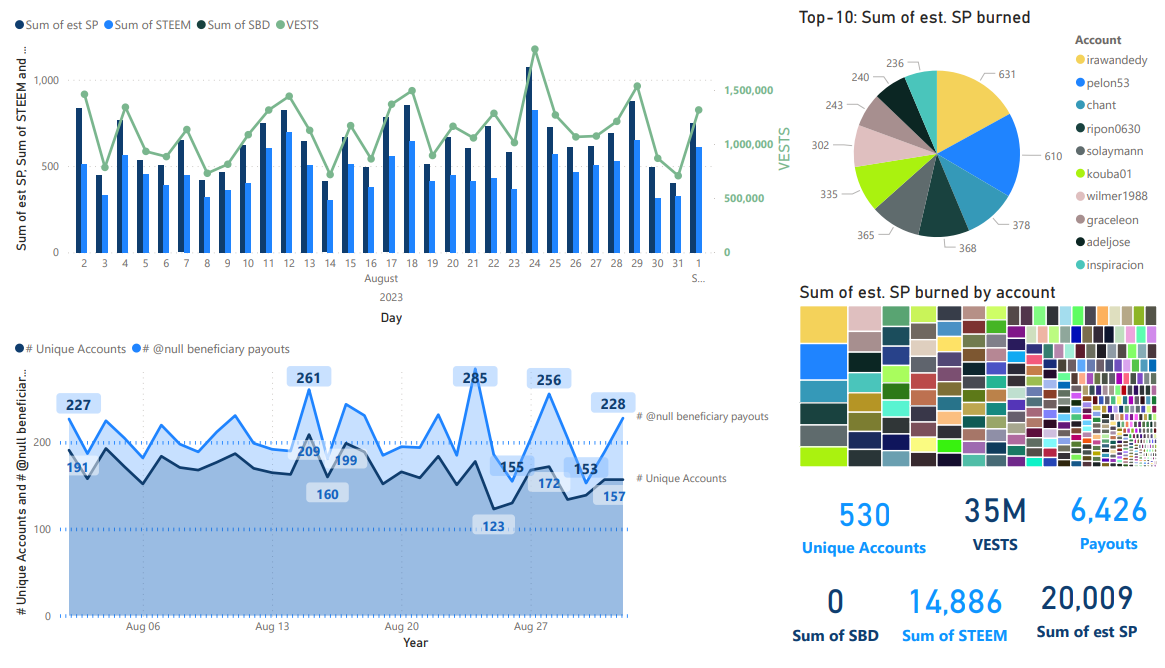
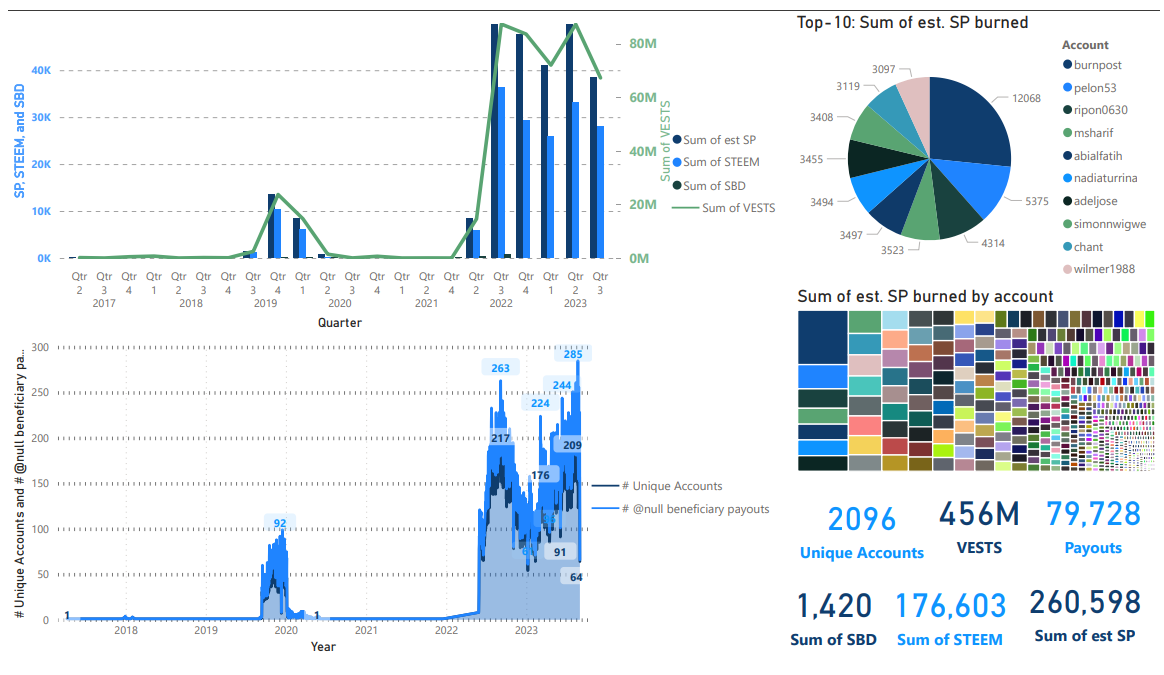
Top sidebar summary cards show total number of STEEM, SP, and VESTS burned, as well as the total number of posts with @null beneficiary settings. The STEEM + SP value is just an estimate, and it doesn't account properly for posts that are set to 100% power-up.
In the center-left sidebar is a new table showing the top-4 days in terms of burned beneficiary rewards.
Bottom-left sidebar summary cards show totals for SBD burned in post promotion.
| Graphs |
|---|
Top-left is a graph showing the number of posts and average SP burned per post by month.
Top-right: This shows the VESTS and the estimated SP beneficiary rewards burned per month.
Middle-left: This is a graph showing the number of posts and average SP burned per post, by day.
Middle-right: This shows the daily VESTS and the estimated SP beneficiary rewards that have been burned.
In all of the above graphs, VESTS are shown against the left axis, SP and STEEM are shown against the right.
Bottom: SBD transfers to @null. As readers are likely aware, SBD transfers to @null can get a post added to the /promoted page. The visualization on the left shows a monthly aggregation of SBDs transferred and a count of unique senders. The visualization on the right shows the daily record.
Slide 3: Rewards summary
Unchanged since August 21, 2022, SBD printing has remained paused. With the present SBD supply, it looks like the median on-chain price for STEEM needs to get back to about $0.252 for SBDs to start printing again. The current median price is $0.155. The burn ratio shows at almost 2.1%, which is up from 2.0% during the last three weeks (after rounding). It should be noted that this estimate doesn't account properly for 100% powerup posts, so the percentage should be thought of as an upper boundary, rather than an exact number.
As noted above, an issue with the API, hivemind, and/or the Steemit web site is influencing these numbers. A drop in overall rewards is visible during the last few days.
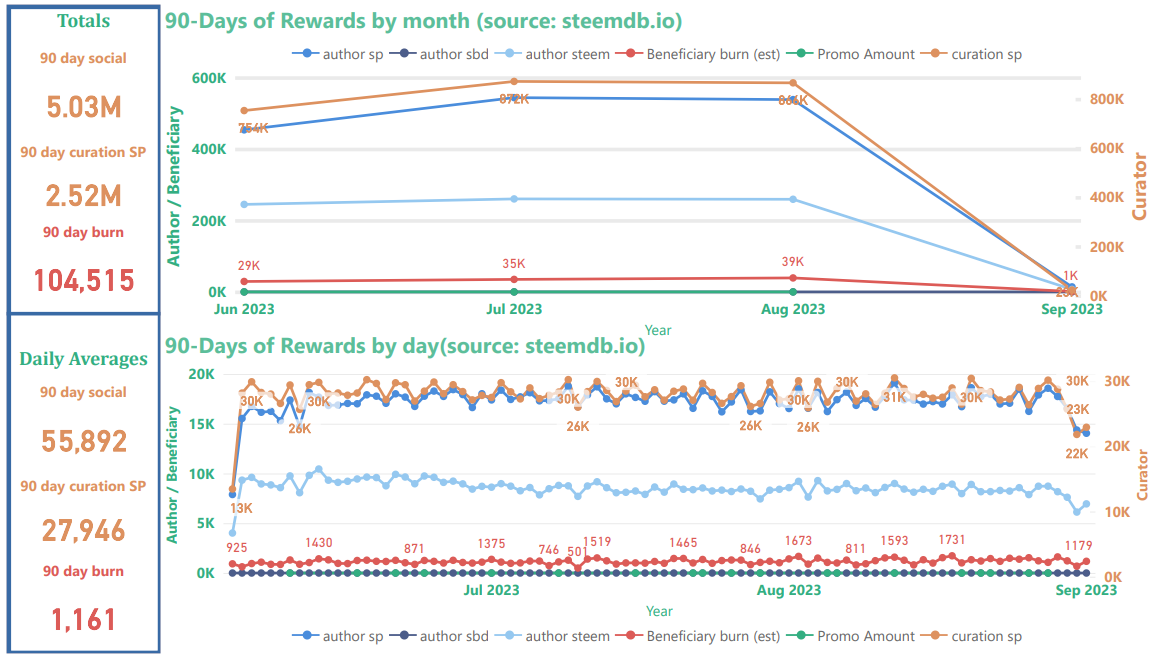
Curator rewards use the scale on the right, author and beneficiary rewards use the scale on the left. Thus, curation rewards appear to be scaled down relative to author & beneficiary rewards. Beneficiary rewards for @null in this chart (red) have been adjusted in order to account for both SP and liquid rewards, but it does not account properly for 100% power-up posts. The top graph shows the monthly aggregations, and the bottom graph shows daily totals.
The top-left sidebar shows estimates for the 90-day total of distributed "social rewards" (author, curator, and beneficiary), the 90-day total of curation rewards; and the 90-day total of burned beneficiary rewards.
The bottom-left sidebar shows estimated daily 90-day averages for the same three values. In both sidebars, "social rewards" are calculated as [curation rewards] * 2. Based on these estimates, the burn rate is about 1.9% of all social rewards (this excludes interest paid for staking, rewards to witnesses, and SBDs to the SPS). This estimate, however, does not account for posts that are set to power-up 100% of rewards.
Slide 4: STEEM & SBD Supply as well as vested (i.e. staked or "powered up") STEEM
Noteworthy this week is that liquid STEEM as a percentage of current supply and of virtual supply increased for the seventh week in a row (top-right and bottom-left charts). Also, the current observed inflation rate is now running around 6.52%, which is down from 6.56% last week and down from 6.89% when I started tracking it on November 26, 2022. The value has ranged from 6.52% to 6.89% since I started tracking it.
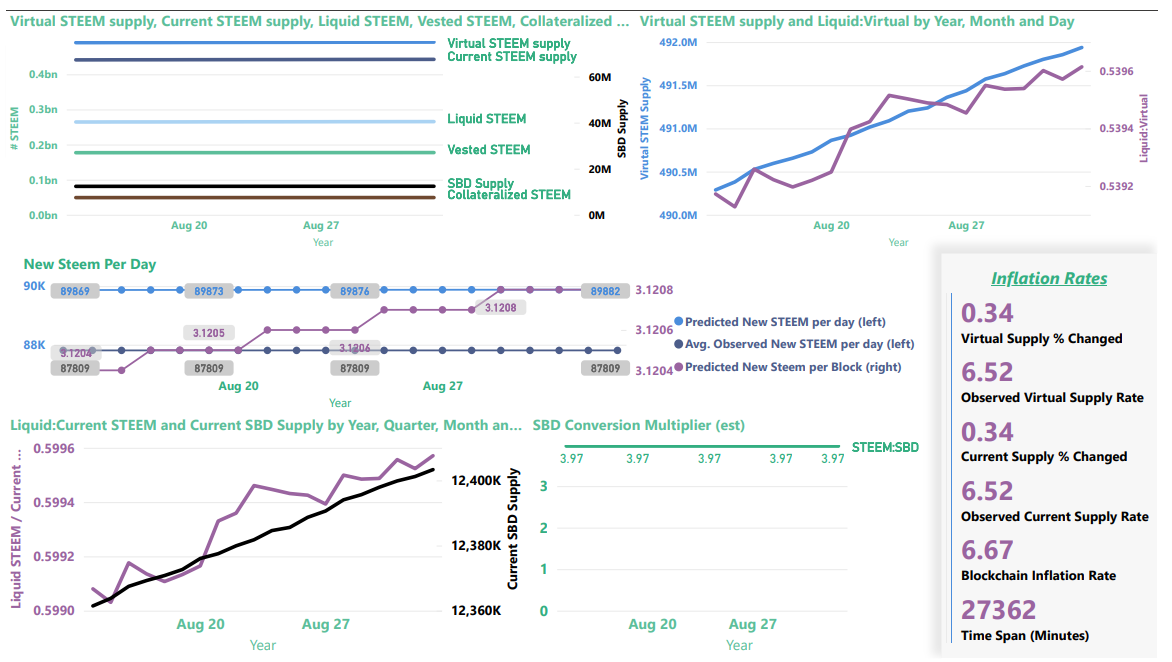
Recent update: An average observed value for new STEEM per day was added in the middle row of the slide visuals. Nearly all of the difference between observed and predicted values is accounted for by burned beneficiary rewards and missed blocks.
The card in the lower-right corner shows the inflation rates for current_supply and virtual_supply, as calculated from the SteemDB API. It also shows the blockchain's current internal inflation rate.
The top-left image provides a summary view of current and virtual STEEM supply, current SBD supply, liquid and vested STEEM, and the amount of STEEM reserved as collateral for paying off SBDs.
| Note |
|---|
Collateralized STEEM and current SBD supply actually represent the same value expressed in terms of STEEM or SBDs, respectively. They're aligned differently on the graph because they use different axes. |
The top-right graphic now contains a zoom-in on "virtual STEEM Supply" (left axis) and the ratio of liquid STEEM / virutal STEEM supply (right axis). As we learned, here, virtual STEEM supply is heavily influenced by price, so with STEEM prices down, it's not surprising to find the virtual STEEM supply increasing. The up-side of this is that it's now possible to burn more collateralized STEEM per SBD with post promotion.
The line graph in the center shows the current inflation in terms of new STEEM per block and new STEEM per day. The slopes of those lines should be identical, since one is a multiple of the other, but they look different because of the different scales from the primary and secondary axes. These are calculated using the formulas from Steemit Corner #2 : Understanding Steem Inflation. As-of July 15, 2022, a value for observed new STEEM per day has also been added. This is calculated as an average from SteemDB.io. The first virtual_supply value is subtracted from the last virtual_supply value, and the difference is averaged over time. At present, I don't fully understand the reason for the difference between the observed daily value and the predicted daily value, but most of the difference can be explained by burned beneficiary rewards and missed blocks.
The bottom-left visualization now contains the ratio of liquid STEEM / current STEEM supply (left axis) and a zoom-in on Current SBD supply (right axis)
The chart on the bottom right shows the value of SBDs in terms of STEEM, according to the blockchain conversion rate, not external markets. This is the inverse of the blockchain's: internal price, as explained here.
Now, here are some more details about each of the values
| Parameter | Axis (left/right) | Meaning | Comments |
|---|---|---|---|
| SBD Supply | right | Number of SBDs in circulation | Equivalent in value to collateralized STEEM |
| Collateralized STEEM | left | Number of STEEM needed to pay off all SBD debt | Equivalent in value to SBD Supply |
| Vested STEEM | left | Number of STEEM staked as STEEMPOWER | |
| Liquid STEEM | left | Number of STEEM that's not staked or needed for SBD collateral | Calculated as (Current STEEM supply - Vested STEEM) |
| Current STEEM supply | left | Number of STEEM in circulation | |
| Virtual STEEM supply | left | Number of STEEM in existence |
Slide 5-8
Instead of using steemdb.io, here are the newer visualizations - straight from the blockchain's API. These cover the last week, the last month, the full burnsteem25 era, and throughout the entire blockchain's lifetime.
Since these graphs come straight from the blockchain API, they should not be affected by the above-referenced problem with missing data.
Last week
Last month
May 29, 2022 to present (The burnsteem25 era)
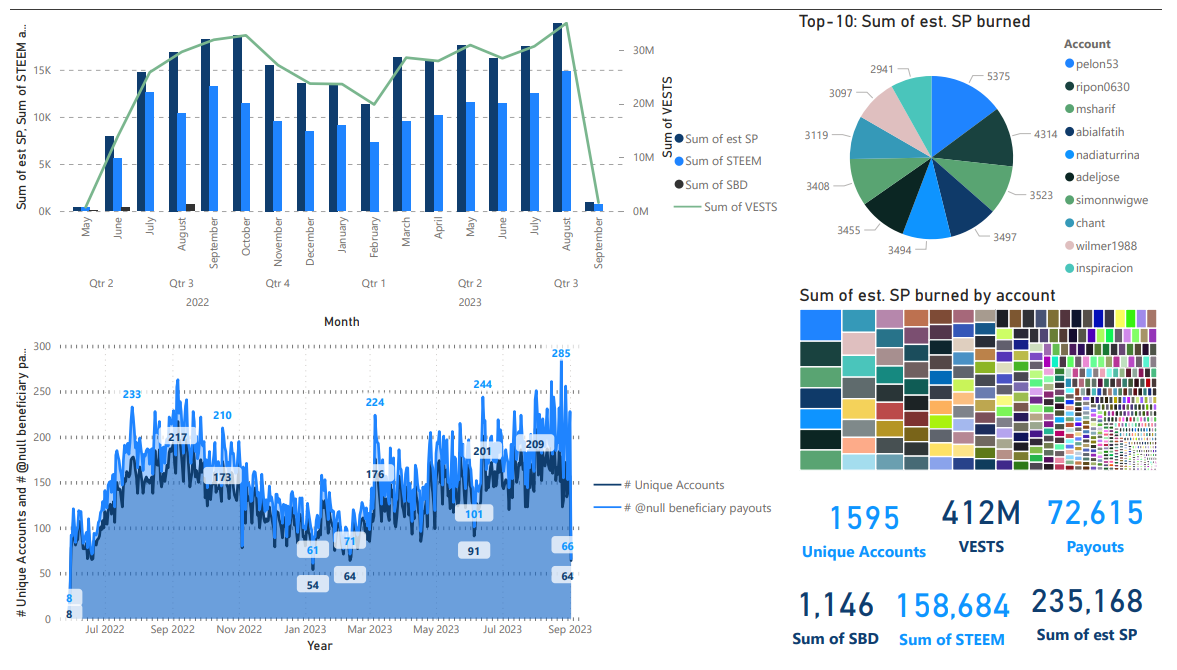
As above, the monthly graph shows that August 2023 was the highest month since the beginning of #burnsteem25.
All time
Slide 9 New August 26
I recently realized that "missed" blocks by witnesses are somewhat analogous to burned STEEM (functionally... 1 missed block is equivalent to about 3.12 burned STEEM - see slide #4). Also, this report tracks inflation information as well as statistics about burn transactions. Accordingly, here is a new slide with some more information. Unfortunately, the SteemDB 'funds' API' is broken, so the bottom-left visualization is stale for now.
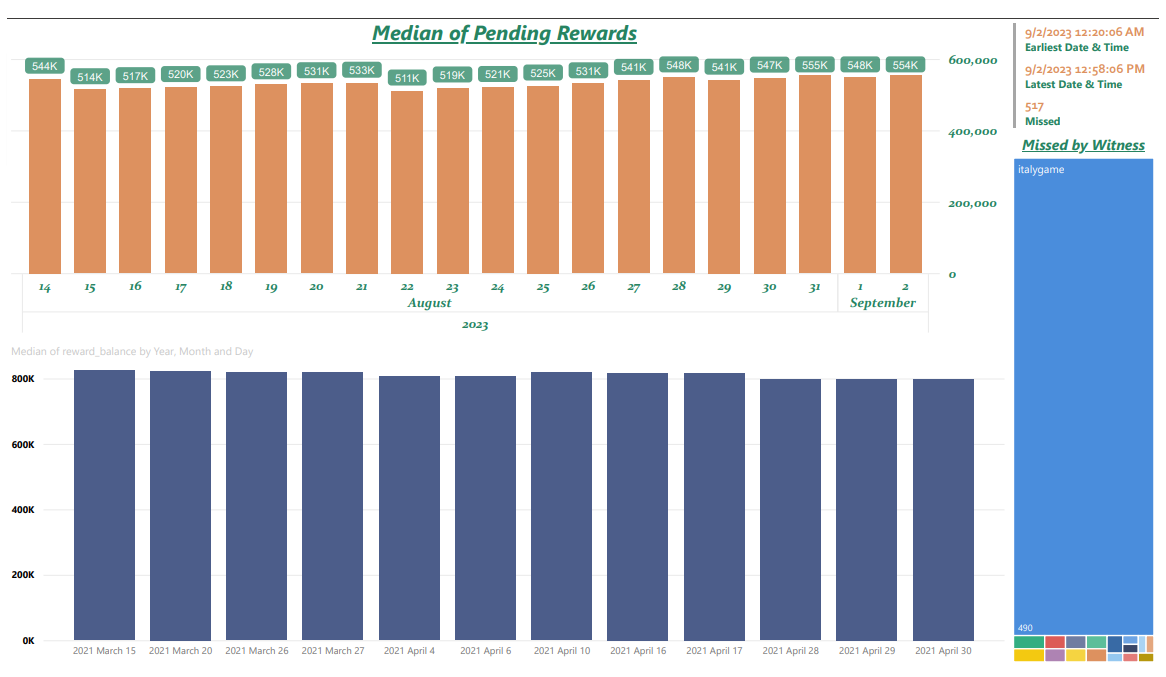
Not sure if the @italygame witness knows that they've been missing blocks, but it looks like this might have been corrected a couple of hours ago?
The top-left visualization shows the current "pending rewards pool", which - I believe - is the rewards that are currently allocated by voters to posts, but not yet paid out. (I haven't actually found that documented anywhere)
The bottom-left visualization shows the total size of the rewards pool. As previously noted, the data is stale, though. I'm hoping that it will be fixed, at some point.
The card in the top-right shows the total number of missed blocks, and the time window that was available from the SteemDB witnesses page when this report was generated.
The visualization in the lower right shows the numbers of blocks missed, broken down by witness.
- The pending rewards come from the SteemDB dynamic properties API.
- The missed blocks come from the SteemDB witnesses page.
-Although stale, the total rewards pool numbers come from the SteemDB funds page.
Thanks for reading!
Previous weeks
- Burned tokens, rewards, and inflation summary August 26, 2023: 231K SP, 155K STEEM, and 1,146 SBD burned in 71K burnsteem25 posts
- Burned tokens, rewards, and inflation summary August 19, 2023: 226K SP, 152K STEEM, and 1,146 SBD burned in 70K burnsteem25 posts
- Burned tokens, rewards, and inflation summary August 12, 2023: 221K SP, 149K STEEM, and 1,146 SBD burned in 68K burnsteem25 posts
- Burned tokens, rewards, and inflation summary August 5, 2023: 217K SP, 145K STEEM, and 1,146 SBD burned in 67K burnsteem25 posts
- Burned tokens, rewards, and inflation summary July 29, 2023: 212K SP, 142K STEEM, and 1,146 SBD burned in 65K burnsteem25 posts
- Burned tokens, rewards, and inflation summary July 22, 2023: 208K SP, 139K STEEM, and 1,146 SBD burned in 64K burnsteem25 posts
- Burned tokens, rewards, and inflation summary July 15, 2023: 204K SP, 137K STEEM, and 1,146 SBD burned in 63K burnsteem25 posts
- Burned tokens, rewards, and inflation summary July 8, 2023: 200K SP, 134K STEEM, and 1,146 SBD burned in 62K burnsteem25 posts
- Burned tokens, rewards, and inflation summary July 1, 2023: 196K SP, 131K STEEM, and 1,146 SBD burned in 60K burnsteem25 posts
For links to updates from 2022 and the first half of 2023, see:
- Burned tokens, rewards, and inflation summary June 24, 2023: 192K SP, 128K STEEM, and 1,146 SBD burned in 59K burnsteem25 posts
- Burned tokens, rewards, and inflation summary December 31, 2022 - Total burn estimates: 207K STEEM/SP and 64 SBD
Pixabay license, source
Reminder
Visit the /promoted page and #burnsteem25 to support the inflation-fighters who are helping to enable decentralized regulation of Steem token supply growth.
A new month is right here and find this metrics post once again. You also contributing like a great steemian as I saw you always follow burnsteem tag and set 25% beneficiaries to null and this deserves appreciation.
BTW, its fine if the post not running penny4thoughts project, my heartiest gratitude to the project as I got uncountable steems already from this project many times. Thank you so much sir Steve for sharing such kindness to we little steemians 💖❤️💝
Thanks for the analysis. Steem burning amount is around the average. we need to come up with ideas for more steem