STEEM/BTC Daily Technical Analysis - 19 August 2016
Hi Steemers
I am giving you daily technical analysis for STEEM/BTC. I prefer to use 1 hour chart for daily analysis.
Checkout the Chart Below.
BITTREX


Indicator Explanation :-
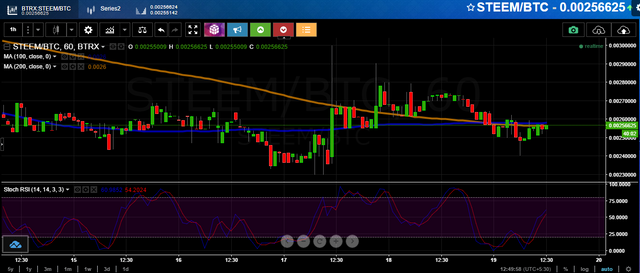
Brown line is 200 Moving Average and blue line is 100 Moving Average. Bottom Indicator is combination of Stochastic and RSI Indicator.
Direction Explanation :-
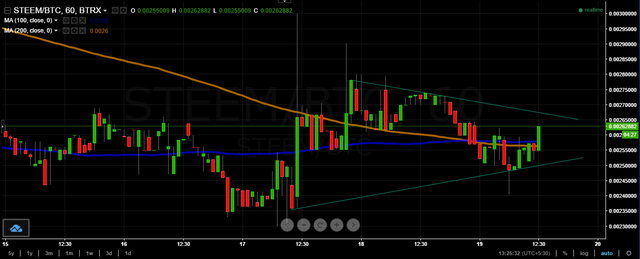
In 1 hour chart of STEEM/BTC on Bittrex. Price started to go up.
100 MA have crossed 200 MA in upward direction so it shows that price started to recover from consolidation and can go up.
Stochastic and RSI also moving upward. So right now from all the scenarios it looks like Steem will go up. Movement of stochastic and RSI shows that buyers are in control and push the price upward.
Symmetric triangle also forming and price looks like to cross the triangle in upward direction. Breakout of triangle will be a good sign that bulls are in control and price could up upward.
DISCLAIMER
The information contained herein is not guaranteed, and is strictly for information purposes only. It should not be regarded as investment/trading advice. All the information is depending upon my personal opinion. I do not warrant the accuracy, correctness, or completeness of information in its analysis and therefore will not be liable for any loss incurred.