RE: $BTS/BTC Poloniex Technical Analysis / Market Report Update #107, May. 19, 2017.
COMMENT
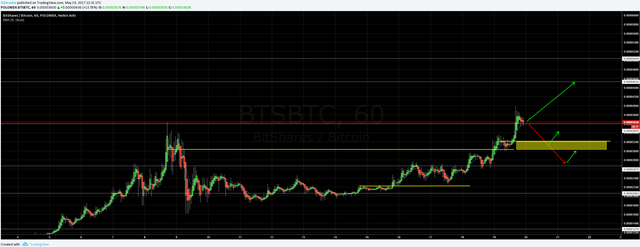
hourly chart
On the hourly chart we can see how the price is in a fight to see if it makes the 3.6k line a new support line or once again act as a resistance level.
In the case of the 3.6k level holding support and the price going upwards, I see it reaching the 4.5k resistance level, which also marks a line from a big fib (as seen on screenshot bellow)
In case of the 3.6k level pushing the price down agian I see it going to atleast 3.2k satoshi where I see a support area which stretches to about 3k satoshi, thus the potential turning point would be somewhere inside that area (marked with yellow rectangle).
Furthermore if this support area fails to hold the next one I see is the ~2.7k level with the 2670 satoshi support line.
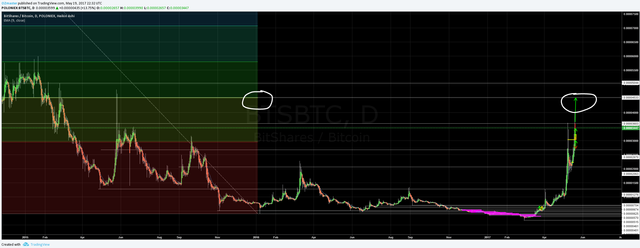
daily chart
Dude your content is gold to me, seriously.
glad it helps :)!
BTS will make all of us rich!