$BTS/BTC Daily Poloniex Technical Analysis / Market Report Update #52, Jan. 14, 2017.
Hello Steemers!

POLONIEX
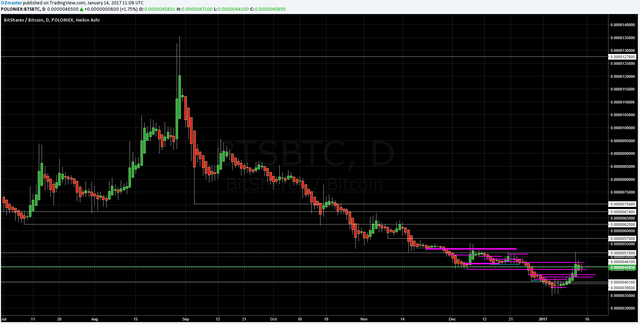
1 day Poloniex chart - Jan. 13, 2017
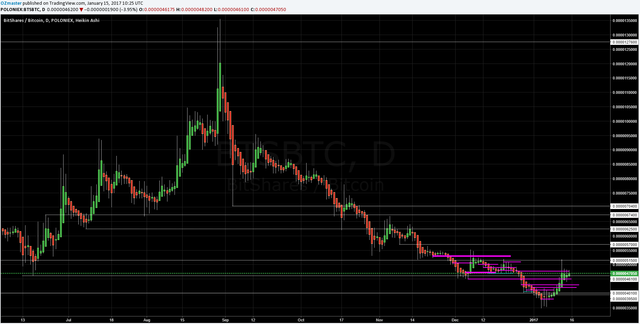
1 day Poloniex chart - Jan. 14, 2017
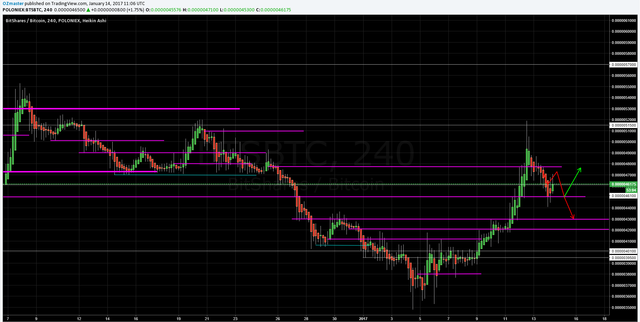
4 hour Poloniex chart - Jan. 13, 2017
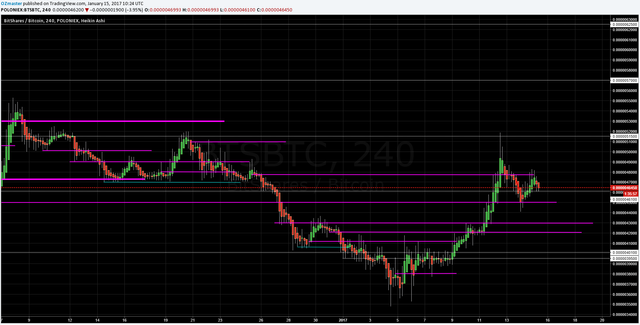
4 hour Poloniex chart - Jan. 14, 2017
The price went up to the 477 resistance line where it briefly spiked above it marking a lower local high at 483 satoshi and then turned down and reached the 461 support line above which it is being held and traded since, at the moment at 465 satoshi.
VOLUME

BTS/BTC volume Poloniex Jan. 13, 2017

BTS/BTC volume Poloniex Jan. 14, 2017

BTS indexed global volume Jan. 13, 2017

BTS indexed global volume Jan. 14, 2017
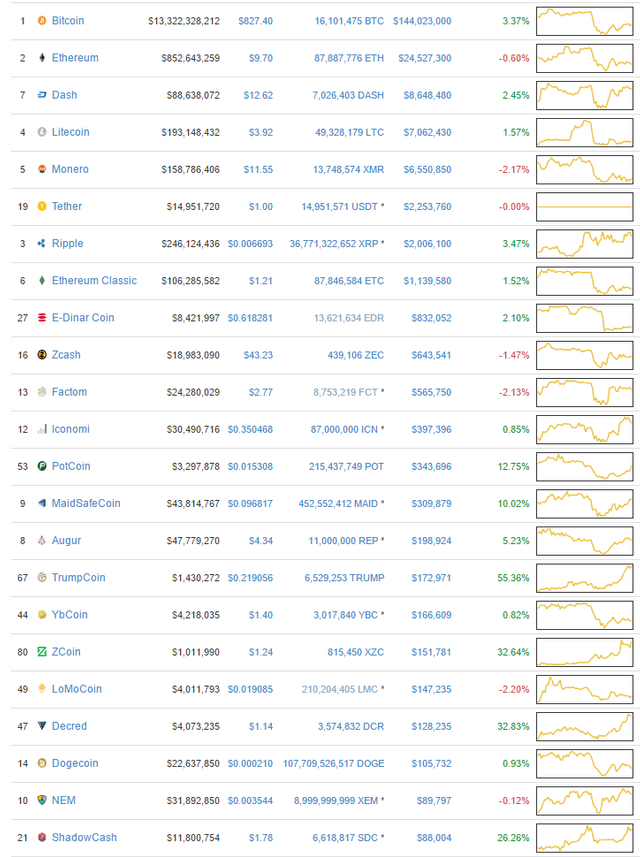

Coinmarketcap top volume cryptos Jan. 13, 2017
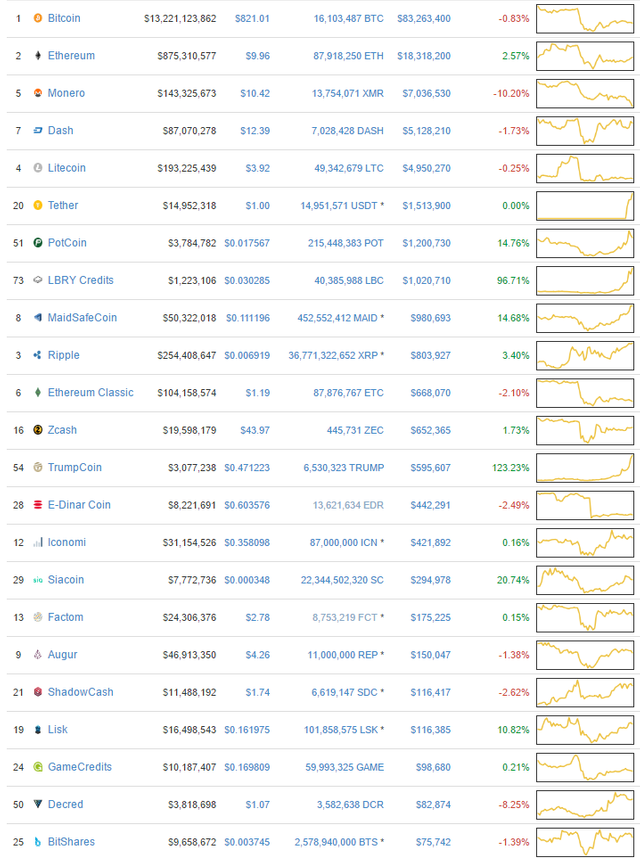
Coinmarketcap top volume cryptos Jan. 14, 2017
Overall volume about 8% higher then yesterday, $BTS on 23th place on the volume rankings.
Poloniex volume about 12% lower then yesterday, volume ~41 BTC.
COMMENT
Once again, I will post the comment by commenting as it involves my personal opinion!
Thank you for understanding!
If anyone has any questions or need's help fell free to ask, I will try to explain as fast and as best as I can.
Critics, comments, reply's, counters, advice's, etc. are always welcome!
Have my charts helped you in any way?Let me know with a comment below :)
Are there more people who are doing TA?
Please post the links to your TA's posts into the comments as well!
DISCLAIMER
I am showing multiple scenarios on the price movement, in the post itself I do not take any stance, either bullish or bearish. I am not responsible for neither you’re winning nor you're losses upon trading! the "comment" section is my personal opinion and does not mean I have to or do hold any positions in the given market.
Everyone who uses TA develops his own unique charting style, please keep that in mind.
Kind regards, OZ
COMMENT
Generally I'm expecting an uptrend move which would break up above the 515 satoshi resistance, but it is a Sunday so there is a possibility of a flattout today before the next move.
Do you use any indicators for your analysis?
on the lower time frames not really, on the higher timeframes I tend to look at the MACD but not as a means to base my direction expectancy on it but rather as an indicator on when to do what I already plan to
does MACD play as your trade signal generator, or at least something like that?
great post
This post has been ranked within the top 10 most undervalued posts in the second half of Jan 15. We estimate that this post is undervalued by $29.43 as compared to a scenario in which every voter had an equal say.
See the full rankings and details in The Daily Tribune: Jan 15 - Part II. You can also read about some of our methodology, data analysis and technical details in our initial post.
If you are the author and would prefer not to receive these comments, simply reply "Stop" to this comment.