Volatility % INCREASE - DECREASE of AVERAGE PRICE MOVEMENT <<>> ME-TARZAN TOP 40 INDEX CHART <<>> January 30 , 2019
🐒 OVERLAID CHART = Volatility % INCREASE - DECREASE of AVERAGE PRICE MOVEMENT with the average price of the top 40 Cryptocurrencies
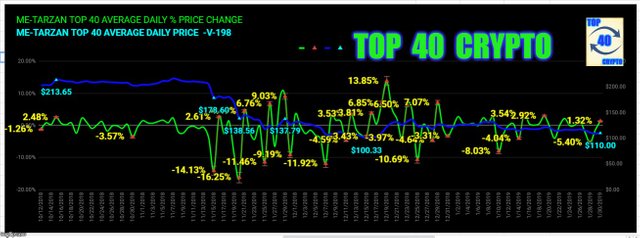
🐒 I have put together a daily chart of the average PERCENTAGE 24hr price movement of the top 40 Cryptocurrencies listed on coinmarketcap starting on October 12 , 2018 I record the data everyday at 7:00 AM EST give or take a few minutes
🐒 This chart also has the average price of the top 40 Cryptocurrencies listed on coinmarketcap starting on October 12 , 2018 overlaid with the BLUE LINE .
🐒
All data recorded daily at 7:00 AM EST
Data information from :
https://coinmarketcap.com/all/views/all/
🐒
🐒 GREEN LINE : Average daily % price Increase - Decrease ((volatility)) of the top 40 Cryptocurrencies
LEGEND PRICE : Left side of chart
🐒 BLUE LINE : Average daily % price of the top 40 Cryptocurrencies
LEGEND PRICE : Right side of chart
🐒
🐒
🐒 The Greatest Average daily % price increase of the top 40 Cryptocurrencies : 13.85% was on December 19 , 2018
🐒 The Greatest Average daily % price decrease of the top 40 Cryptocurrencies : ( -16.25% ) was on November 20 , 2018
🐒 Today's Average daily % movement in price of the top 40 Cryptocurrencies : 1.32%
SUMMARY
🐒 I will be watching the top 40 Cryptocurrencies Volatility overlaid with the daily average price of the top 40 Cryptocurrencies for a high percentage break out upwards on the Volatility first to signal a change in the price trend from sideways to up in the Crypto markets . (( JMHO ))
Please voice your opinion below.
🐒
DISCLAIMER :
This content is for informational, educational and research purposes only.
Please get the advice of a competent financial advisor before investing your money in any financial instrument.
It is strongly recommended that you consult with a licensed financial professional before using any information provided here . Any market data or news commentary used here is for illustrative and informational purposes only.
Trading involves a high level of risk. Future results can be dramatically different from the opinions expressed herein. Past performance does not guarantee future performance. Consult an investment professional before investing.
All ideas , trade signals , opinions and/or forecasts are for informational, educational and research purposes only and should not be construed as a recommendation to invest, trade, and/or speculate . Any investments made in light of these ideas, trade signals , opinions, and/or forecasts, expressed or implied herein, are committed at your own risk. I am not an investment advisor, information shared here is for informational, educational and research purposes only and not a recommendation to buy or sell anything .