Bitcoin Cash Price Update - Potential Reversal Sign?
Hey guys, Bitcoin Cash had a horrible day yesterday, I think it fell about 26% against the US dollar but we might have found some support now. Here is the daily chart:
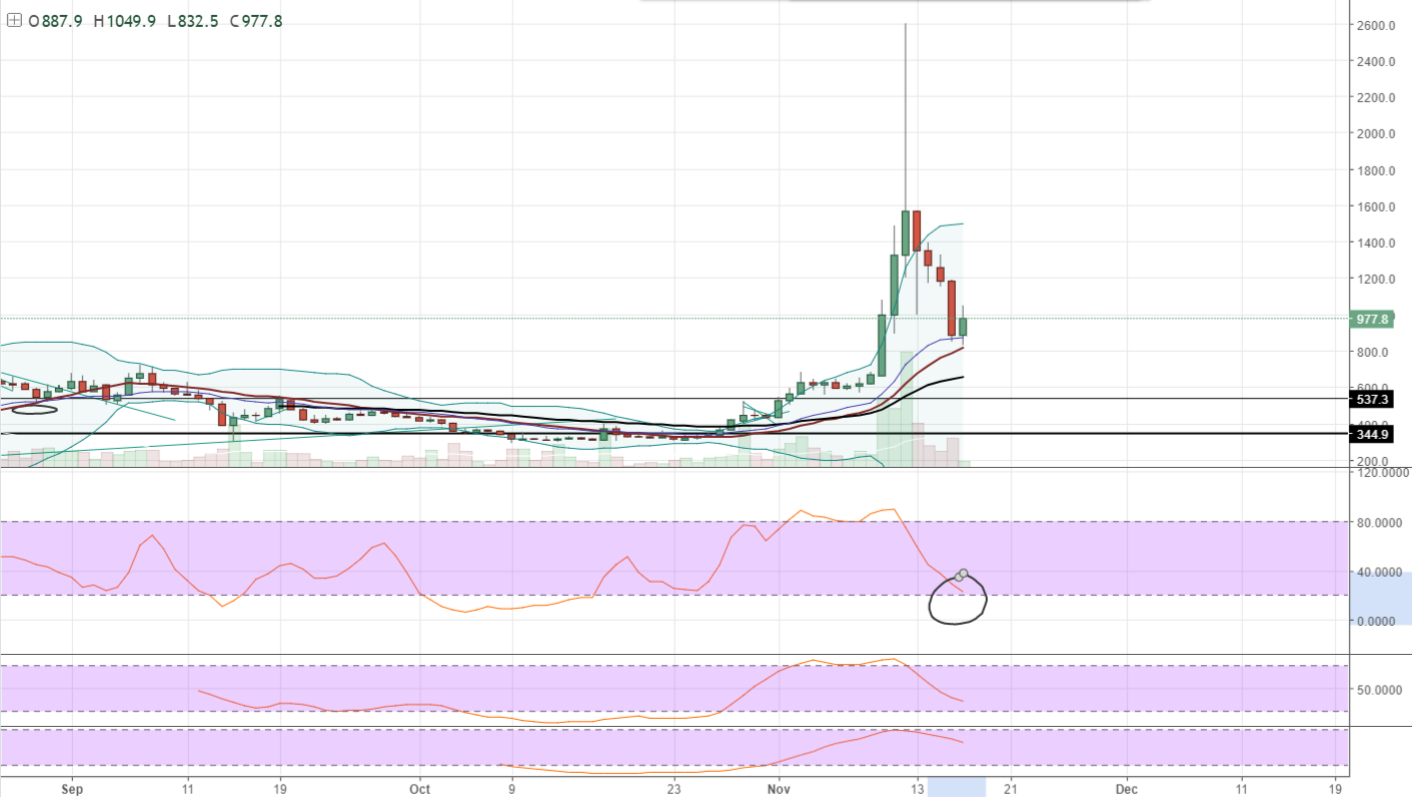
Comment: The lines in the chart are moving averages and the red/brown line is the bollinger band median where we actually have made a temporal bottom. We will see if this will hold because on the 4 hour chart we actually have a stochastic divergence.
I will show you here:
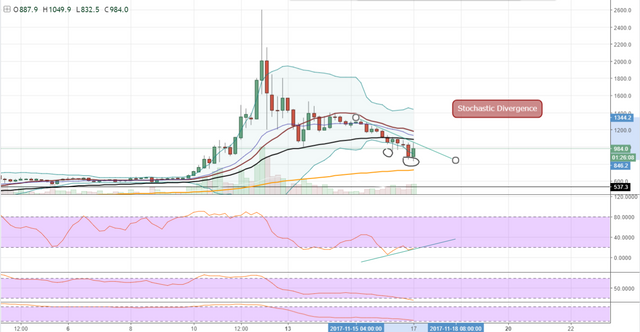
Comment: That means that we made a lower low on the price meanwhile we made a higher low on the stochastics.
Look out for a breakout above the descending trendline, then we could try to make another move up.
Happy trading!