From the most bearish bitcoin scenario to the most bullish
Bitcoin weekly Renko chart

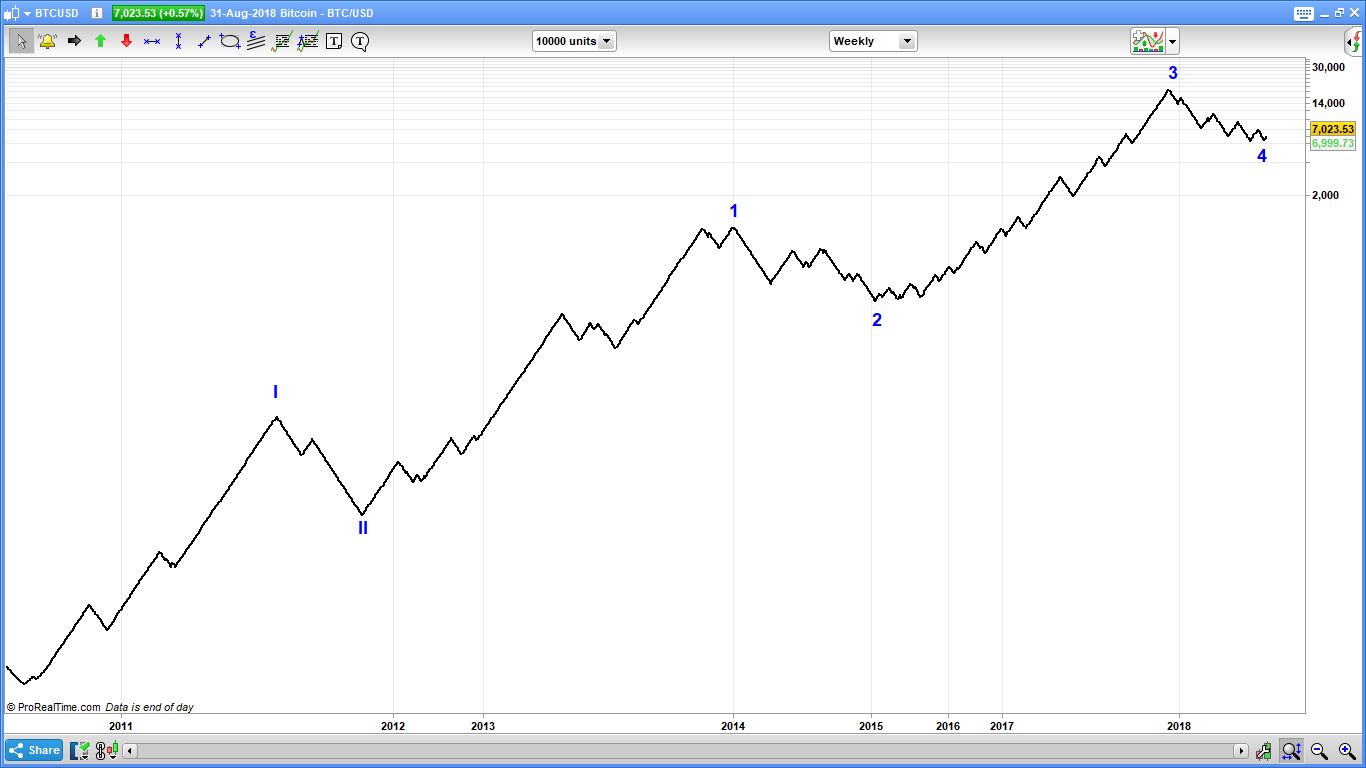
The above chart shows bitcoin data from the middle of July 2010 until today and we can clearly see an Elliott five wave impulse that seems to have been completed. The theory states that prices should now drop more or less to the previous wave four, which is around 200$.
I repeat: 200$. That is a long way down and will certainy shake out just about any investor as it will shake out numerous underfunded crypto projects, self regulate ICO's into oblivion and cool off even the most enthusiastic believers. Should prices move down to 200$ then this is a gift from heaven as you will be able to load up on the coin at bargain prices.
Do I believe it?
No.
There is an alternative.
Any impulse can be extended and strong moves usually have extensions, meaning we'll get a chart like below.
Or even a double extension, for a vertical take off take that only John McAfee expects and that would challenge the ballistic ascent of Maria Magdalena into the heavens

Important is that the move sideways to down, where we're in now, so far, looks very corrective, as opposed to impulsive, meaning tops and bottoms overlap, contrary to an impulse where tops and bottoms do not overlap. Consequently, a new impulse up must follow. The question then becomes: where is this bloody thing going to bottom? For the moment there are no signs that a bottom has been made, so a bearish outlook is obligatory.
Just for the fun of it, we can have a look at two other long term charts.
Ethereum weekly Renko chart

Ethereum has completed a 5 wave impulse and is near completing a three wave correction. Visually, a beautifully principled textbook Elliott wave impulse: 5 wave up, 3 waves down. Ethereum is ready to roll, Elliott wave wise that is, into a new, higher time frame Elliott impulse taking the coin to stratospheric heights. But, first the correction must be completed and we have room to drop to 150$. Which, by the way, is an almost 50% drop.
Litecoin weekly Renko chart

Litecoin looks a bit more ambiguous. For now it seems to be in a wave 4, with a wave 5 to follow, possibly extended, or the impulse ended somewhere where the current wave 3 is labeled and we're in a correction of that first completed impulse. Or this wave 3 will get extended, which is actualy a bit more likely. We'll see.