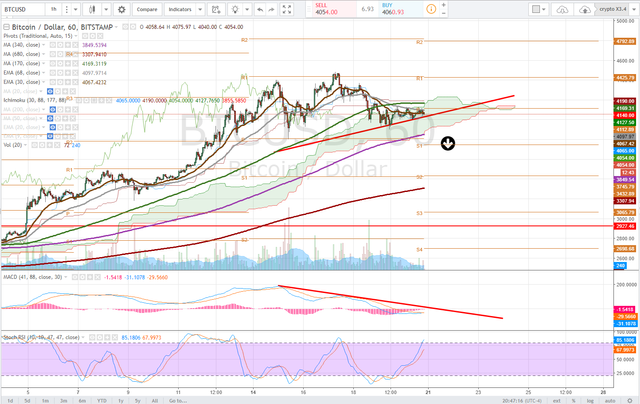
One Hour Bitcoin chart shows an ascending triangle which is a bullish formation. Breaking upwardly the resistance at $4125 would grant a target at $4350 .
Looking good. Nothing wrong with a little a consolidation before the next move up. Cryptos are looking great. Lots of money moving in and raising the total market cap. Hopefully, it keeps up.
I don't think she's going to break out for more all time highs, just action is not that progressive, we shall see of course. 3808 is a line in the sand if it drops.
This is what im watching and its the downtrending MACD that caught my attention, which made its way to zero. She need momo on this cycle or...
(all tools and moving averages adjusted for 24hour trading)
This kind of negative diversion appeared on MACD (down-trending MACD) has given its effect already by falling price from $4480 to $3900 then the consolidation we are witnessing right now . I think we are bout seeing a new MACD buy signal.
I would think not, if we take it from a longer term view, this waning momentum, just as the macd can exceed 0 on crypto exploding to heights of 200 deviations, it can also go down that much. Its on watch, very bearish lean on my part, but i totally respect your view!
Looking good. Nothing wrong with a little a consolidation before the next move up. Cryptos are looking great. Lots of money moving in and raising the total market cap. Hopefully, it keeps up.
I think we will see the level of $5000 soon .
Watching that too but needs to set a higher high i think or could drive leg lowrr and have weird looking h&s. Its fun to chart these
Not sure about lower leg but we all agree it will upwardly break :)
I don't think she's going to break out for more all time highs, just action is not that progressive, we shall see of course. 3808 is a line in the sand if it drops.

This is what im watching and its the downtrending MACD that caught my attention, which made its way to zero. She need momo on this cycle or...
(all tools and moving averages adjusted for 24hour trading)
This kind of negative diversion appeared on MACD (down-trending MACD) has given its effect already by falling price from $4480 to $3900 then the consolidation we are witnessing right now . I think we are bout seeing a new MACD buy signal.
I would think not, if we take it from a longer term view, this waning momentum, just as the macd can exceed 0 on crypto exploding to heights of 200 deviations, it can also go down that much. Its on watch, very bearish lean on my part, but i totally respect your view!