BTC and USDT are exhibiting bullish divergence…
Currently, the USDT and Bitcoin charts are showing some divergence.
Particularly, we are observing an increase in USDT domination as the price of bitcoin declines.
The RSI, though, is what makes this chart very intriguing.
As USDT dominance rises, the RSI is flat, which is negative for USTD dominance.
Look at this:
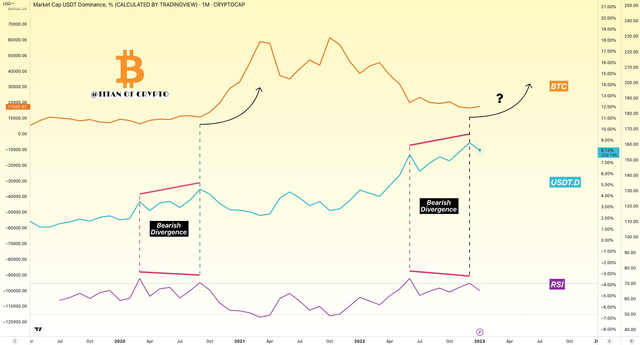
What makes this intriguing?
Now, if we go back and examine the monthly chart for the previous instance, we can see that this occurred just before bitcoin started a multi-month surge higher.
By the way, since this is a monthly chart, it will take some time for it to unfold.