Bitcoin Technical Analysis: QUICK UPDATE
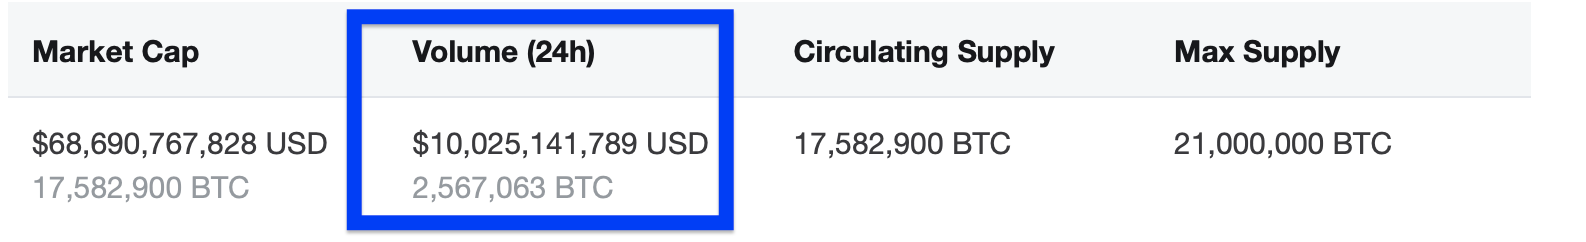
Bitcoin continues to consolidate within a wedge, creating a series of lower highs and higher lows. I’m expecting a larger move as it approaches the apex. Volume remains relatively high, just above $10 Billion for the day.
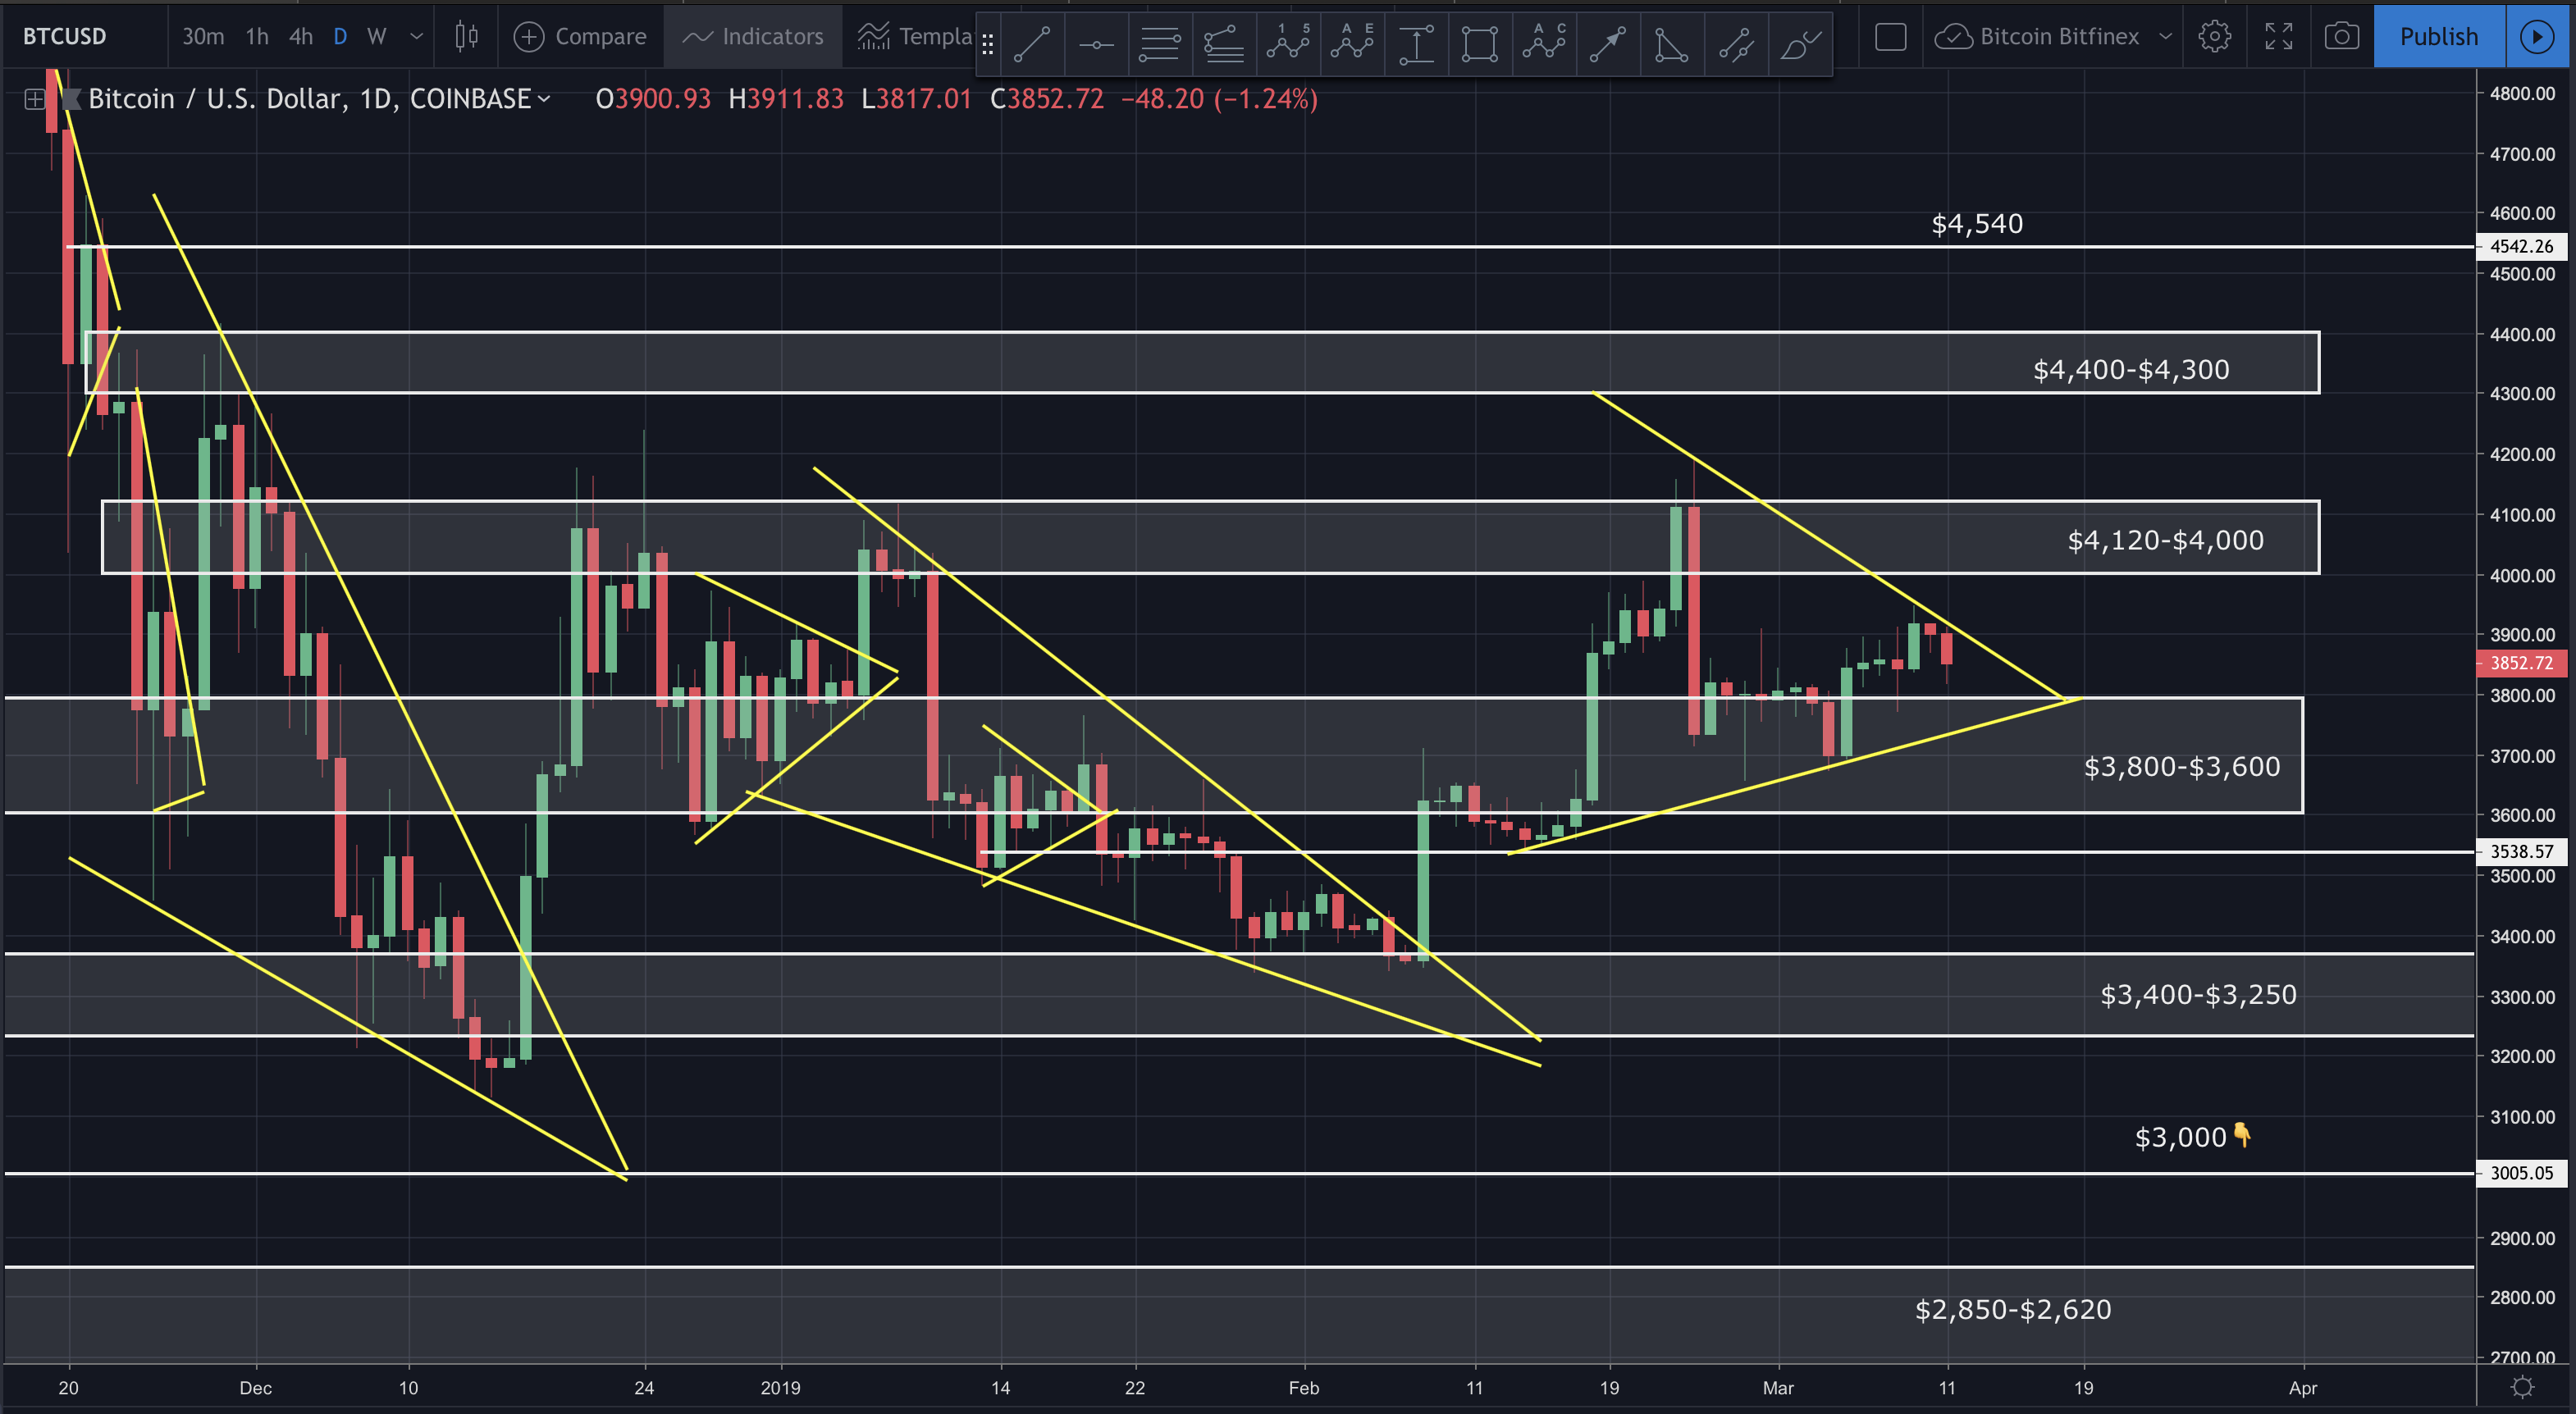
In today’s analysis I discuss, where price may go in the coming days/weeks, short term trades I’m considering, traps to avoid and so much more. I hope you find it helpful.
Video Analysis:
If you don’t see the above video, navigate to TIMM (https://mentormarket.io/workin/) or Steemit in order to watch.
I hope this has been helpful. I’d be happy to answer any questions in the comment section below. Until next time, wishing you safe and profitable trading!
Workin
If you found this post informative, please:
Open an Account on Binance here:
https://www.binance.com/?ref=16878853
Support the Crypto Ecosystem with Brave Browser:
https://brave.com/wor485
Twitter handle is @Workin2005 and Facebook is https://www.facebook.com/Workin2005
Feature Image By: Saul Gravy


Top information! That 4100 zone is right at where the 20Ma weekly is, which to me is a major resistance, I'm expecting a drop, but imho I think we will shoot straight down to around 1800$, but let's wait and see, stoch RSI on the weekly is starting to go bearish, it's at 100, last time it was at 100 was during the ATH.
Thanks my friend. You’re right, $4,100 is without question a major resistance. Zooming out on the daily chart makes that painfully obvious. I discussed my plan to short (if certain criteria is met) in the video.
I can see a path to below $3,000. I know Vays and a few other analysts are calling for $1,800. Personally, I think there’s a good chance it’ll find support between $3,000 and $2,500 as long as volume remains strong. If that breaks down, I feel it’ll likely free fall to $1,200. There's just no support between $2,500 and $1,200. We’ll see.
I'm basing this on the trendline that I did that looks like the previous bear market trendline, where we touched it twice before accumulation, here let me show
https://www.tradingview.com/x/5aIcJz6d/
If we headed straight down right now we would touch 2k on the trendline. Ofc the capitulation is slow at first and then picks up, we might very well go to 1.2k , but the trendline that I'm considering is that one, I know some traders don't like trendlines but I love them for investing, for trading ofc fib, elliot waves, RSI and some PA
And Vays actually says we are heading down to sub 1.5k xD and other analysists say the same, I'm keeping my sentiment in check because I too think we are heading down to sub 1.8k.
Trend lines can be great. Guess it depends on the trader and how you use it. Personally, I think the overall trend, coupled with major resistance at $4,120, suggests a break down. Add to that sever hidden bearish divergence on the weekly chart's MACD, as well as a large bear flag...yea, things could get ugly quick.
My first buy zone is $3,000-$2,500 with a tight stop. That breaks, I'll go in heavy between $1,200 and $1,000. Good times. ;-)