Bitcoin Technical Analysis: ARE THE BULLS BACK?
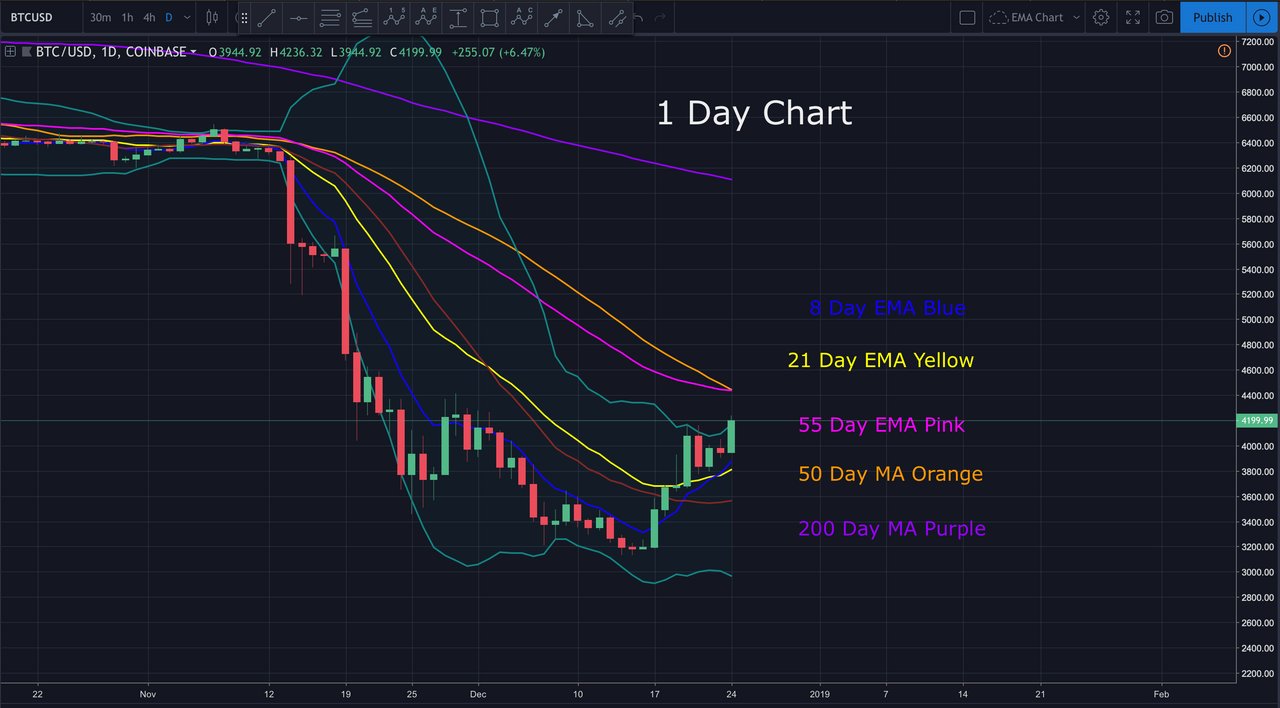
Bitcoin just broke above a key resistance at $4,120. It now seems to be acting as support. There’s strong resistance (supply zone) between $4,315 and $4,400.

Looking at the daily chart, we can see price approaching the 50 Day MA. It’s also hitting the top daily Bollinger band. Between the top daily Bollinger band and the $4,400 resistance, bitcoin has some work to do. A break above the 50 Day MA (on the daily chart) would be an extremely bullish sign of strength if confirmed with volume.
In today’s video analysis I discuss where price may be heading next, traps to avoid and so much more. I hope you find it helpful.
Video Analysis:
If you don’t see the above video, navigate to TIMM (https://mentormarket.io/workin/) or Steemit in order to watch.
I hope this has been helpful. I’d be happy to answer any questions in the comment section below. Until next time, wishing you safe and profitable trading!
Workin
If you found this post informative, please:

Open an Account on Binance here:
https://www.binance.com/?ref=16878853
Support the Crypto Ecosystem with Brave Browser:
https://brave.com/wor485
Twitter handle is @Workin2005 and Facebook is https://www.facebook.com/Workin2005
Published by Workin
on

one scenario is that Bitcoin holding it's price over the 200 EMA and breaking the pattern's neckline with volume confirmation. This scenario can bring quick gains but is weaker in the long term (leaves less probability for bitcoin to reach the 5k target).
please take a look at me latest post and tell me what's ur opinion
https://steemit.com/bitcoin/@orphism/bitcoin-s-green-christmas