Bitcoin & Ethereum price analysis - July 25th
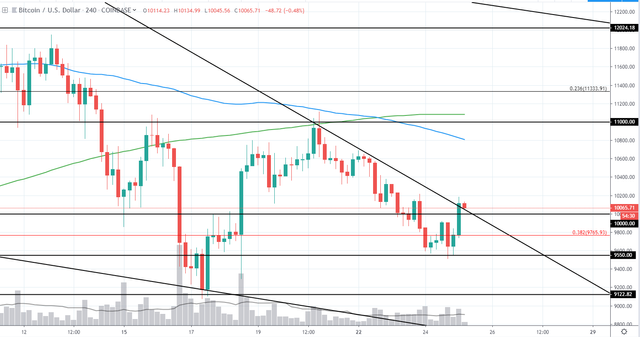
Bitcoin has a market cap of 180.3 billion USD and trades around 10053 USD on Coinbase after establishing a double bottom around 9550 USD earlier and trading towards several week trend line, break of which could indicate reversal to bullish momentum in upcoming weeks. Additionally price has reached previous minor swing high of around 10.2k USD after breaking 9.9k swing high set yesterday indicating bullish momentum is starting to build. If break of previously mentioned resistances is achieved next target for price to the upside can be seen around 10.8-11.1k USD where previous medium term swing high is located as well as 100 and 200 period moving averages can be seen – blue and green line respectively. Alternatively if price manages to hold below 10.2k and resistance trend line, it is likely we will see continuation to the downside with 9.55k and 9.1k USD levels seen as next supports.
BTC/USD 4H:
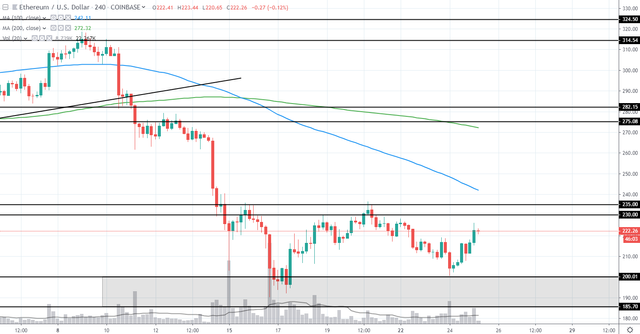
Ethereum currently has a market cap of 23.8 billion and trades at 222 USD on Coinbase after retest of 200 USD support level mentioned yesterday which set a higher low, indicating bullish momentum forming and price looking to break 230-235 USD resistance zone, where previous local high can be seen. If break is achieved we could see move as far as 270-280 USD, where next resistance and 200 moving average is located.
ETH/USD 4H:
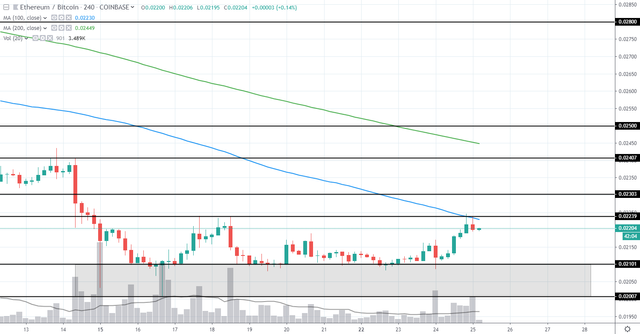
Looking at ETH/BTC an upside momentum can be seen and price finally moving away from several day support of 0.021 BTC and retesting local swing high of 0.0224 BTC and 100 period moving average seen as blue line on the chart. Price has rejected these resistance levels for now, indicating we might see further bearish momentum in upcoming 24 hours.
ETH/BTC 4H: