Bitcoin in a Bubble? No Way!
Now that Bitcoin is reaching the recent ATH of just two weeks ago already, there are many pages devoted to the question whether Bitcoin is in a bubble or not. I think this is probably not the case, based on 2 arguments:
Technical Analysis: when comparing the current Bitcoin price action to previous Bitcoin 'bubbles', the current price does not indicate extreme price action. Far from it
It is fair to assume that Bitcoin adoption has a certain exponential factor, and probably takes (or will take) the form of an S-curve adoption. When thinking Bitcoin, one should think exponential opposed to linear.
Both arguments are explained in further detail below.
What the charts tell us
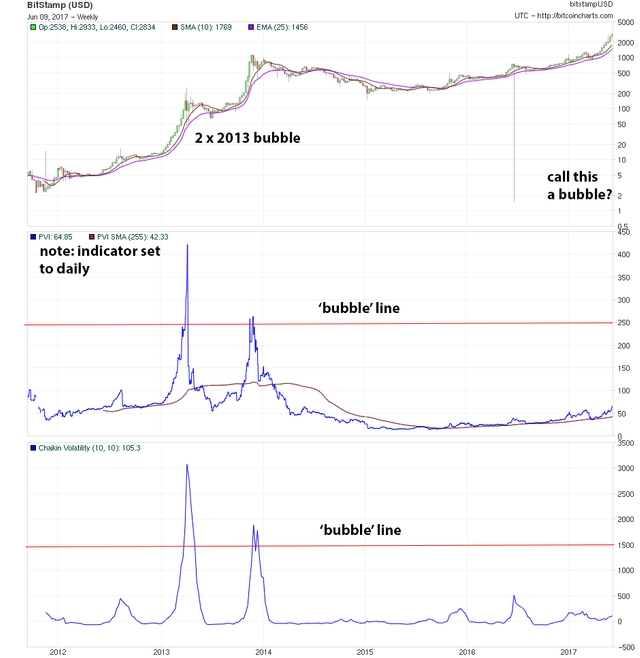
Bitcoin, although young, already has some history. That's very helpful for charting. I took the following chart from Bitcoincharts and added some clarifications:
What you are looking at, is a long term 'weekly' Bitcoin price chart. Some key elements:
- the chart is logarithmic. Because Bitcoin involves an exponential component (see next chapter), using linear charts is severely misleading from my point of view. The basic idea of a logarithmic chart is that a price doubling, whether it is from $1 to $2 or $10,000 to $20,000, is equally sized on the chart. This makes an exponential growth line a straight line instead of a loop bending sharply upwards
- the PVI (Positive Volume Indicator) is taken from the 'daily' chart. I copied it in this 'weekly' chart
- the Chaikin Volatility Indicator is based on the 'weekly' chart
- the comparison is made to the previous 2 Bitcoin bubbles (both in 2013)
When looking at the two 2013 price peaks, the two indicators clearly show an enormous peak round about the top of the price peaks. You do not have to understand what these indicators exactly do or how they work; just look at the price history and what these indicators showed in 2013 and what they currently show.
Based on this comparison, there is no bubble whatsoever. If someone talks 'bubble', it is a whole different type of (tiny) bubble than the 2013 mania. Without pretending accuracy, a 2013-style bubble would require the Bitcoin price to be way above $10k right now. We can surely hope, but to me, the current price ain't 'bubbly' at all.
Price projection
I made a Bitcoin price projection in March 2013 (yes, before the first real outbreak of the two 2013 bubbles). The below is a rehash of that post.
The trouble with projections is...... that it they are just that: projections. The sheet posted below is full of assumptions and hand tweaking of numbers to make the graphs look nice. Having said so, let's spit out the outlines of this projection.
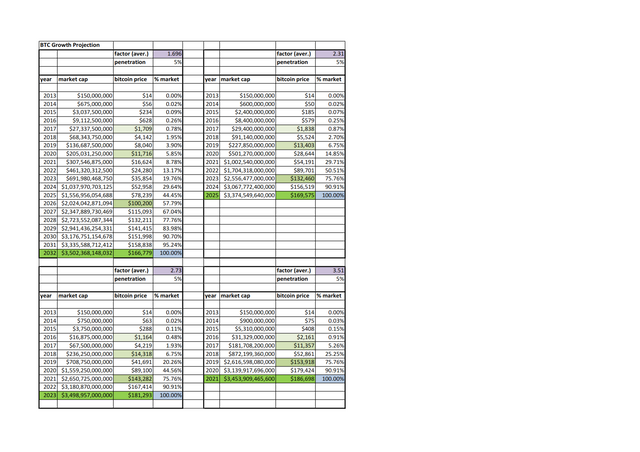
- I assume an exponential average annual growth factor between a cautious 1.6 to an aggressive 3.5 (the average since 2010 is actually closer to 4.2)
- I took 2013 as the starting date (with $150,000 market cap)
- I assume a S-curve type price action (meaning slow start, then a fast growth in the middle followed by slow growth at the end)
- I manually made a correction in the S-curve to account for BTC's inception in 2009 instead of 2013 (meaning: I assume it was already in fast growth mode in 2013)
- I assume a final 5% market cap of the current $70-80 trillion of money in the world (if Bitcoin persists, I don't think that is an unrealistic assumption)
- key moments are highlighted: $1,000: light green, $10,000: darker green, $100,000: even darker green, full market cap: green
Of course, none of this is scientific; its make believe. Nonetheless, the better my assumptions are, the better insight of the possible price projection. The events since 2013 prove that these assumptions were not that unrealistic so far (or more neutral: not proved evidently false yet :) ). My main assumption is, of course, that Bitcoin will survive all those years and will actively be developed further and evolves in the premier currency of the Internet, reaching a 5% market cap of all money used in world trade.
Excel spouts out the following sheet:

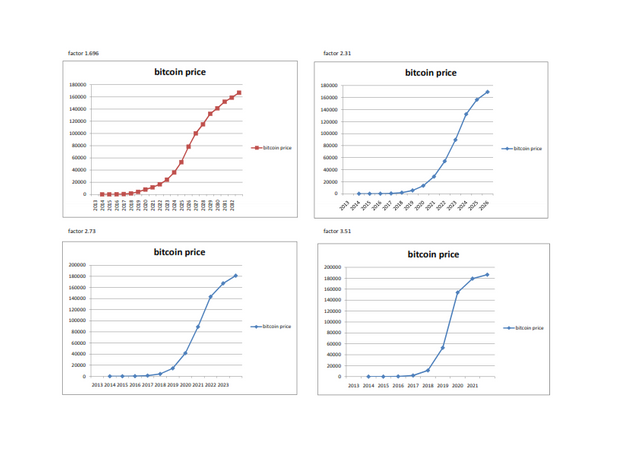
I also post the graphs that belong to the sheet:

The graphs are not that interesting. In all scenario's, the price of Bitcoin will reach $180,000+ at some point with the S-curve obviously present in all projections. Details of the current period that we are in are basically invisible in the small numbers; it won't be really visible until we reach the big price leap. The only thing interesting is the time frame involved, but that is clear from the sheet as well. Nevertheless, for the power-graph hungry people I included the graphs.
From the sheet, it appears that a slow scenario vs an aggressive scenario is only 10 years. Nevertheless, if your goal is $100,000/BTC, then it makes a lot of difference whether we assume an Android/Youtube/Fabecook scenario with a very aggressive growth projection (very fast adaptation, 3-8 years) or an Intel/Phone/TV route ('normal' scenario, 10-20 years).
In 2013, I happily wrote that the good news is that reaching $1,000 would happens more or less at the same moment. Of course, not knowing that $1,000 would already be hit ' bubbly' in 2013. Anyway, in each scenario, the $1,000 mark was to be reached anyway within the time frame 2016-2017. So we are comfortably in this scenario with Bitcoin reaching $1,000 without blinking an eye this time.
After hitting $1,000 in the scenarios, the differences start to grow. While reaching $10,000 comes relatively fast in all scenario's, reaching $100,000 would take some time. Also in the aggressive scenario, the wait lasts until 2019. However, that is only 2 years away but I think my aggressive scenario does not really seem to match reality that closely.
What I take away from this calculation exercise:
- even with a 5% market cap target, the rewards over time look very promising if you get in now with one single BTC
- really high prices ($100,000+/BTC) will take some time regardless of the scenario (so for those that only started now, please have some patience (next to steel balls)
- reaching $1,000 was a breeze as 2013 and recent events showed
- and the final kicker: look at the aggressive scenario and think of being wrong: namely that the actual scenario will prove even more aggressive ....
Please let me remind that the above is pure speculation and based on assumptions. The only solace I can offer is that developments since 2013 have not completely rendered these assumptions dead wrong (instead, I am quite content with the developments). The exponential factor is gravely misunderstood by humans in general.
The only thing I really wonder is whether the steep part of the S-curve already started or is still to begin. I have the feeling we are still very much in the early phase but close to picking up a lot of 'steem' (pun intended).
So what about the future?
My own thoughts about Bitcoin, the potential of crypto currency, growth in adoption and the increasing process of digitalisation in general, make me confident to stick to a buy and hold (HODL) strategy. The way HODL-ers have the balls to hold is that they understand what is happening. The world is switching over to secure digital asset ledgers. They are simply unquestionably superior. Since most first user HODL-ers already cashed out enough fiat currency to meet a certain fiat HODL-ing feeling of financial security, the only thing they care about is increasing their share in that asset register.
"We evolve the way Stephen Jay Gould described evolution: through punctuated equilibrium. That is, we pass through bottlenecks, forced upon us by the circumstances of nature, only in the case of the present global issues we are nature itself. And there’s nothing we can do about it. If we don’t manage to understand this dynamic, and very soon, those bottlenecks will become awfully narrow passages, with room for ever fewer of us to pass through." - source
We know the current financial system is not sustainable. We know Great Financial Crisis of 2008 was only a prelude of what is coming. We know that we need to gather forces and change the way we do things. And now we have Bitcoin.
As Stewart Brand said: “Once a new technology starts rolling, if you’re not part of the steamroller, you’re part of the road.”.
So am I still bullish on Bitcoin/crypto currency? Yes, madly bullish.


Disclaimer: I am just a bot trying to be helpful.
Congratulations @wekkel! You have completed some achievement on Steemit and have been rewarded with new badge(s) :
Click on any badge to view your own Board of Honnor on SteemitBoard.
For more information about SteemitBoard, click here
If you no longer want to receive notifications, reply to this comment with the word
STOPBy upvoting this notification, you can help all Steemit users. Learn how here!
Yep, agreed
Very nice post:)!
I thoroughly enjoyed your analysis and Bitcoin forecast for the future. Your charts make sense in many ways and it looks like a lot of hard work. My only criticism is the time tables because trying to forecast a decade ahead in this volatile of a market is pretty much impossible.
Let's all remember that this world will face heavy regulation at some point. The nations and regulatory agencies will have a very hard time continuing to ignore this market when it approaches a trillion dollars.
Keep the end goal in mind and HODL through the storms ahead!
Thanks for your response. Let me state again that these were made back in 2013. I could have tried to remodel them to fit the additional data available now but thought it charming to show how outrageous claims back then proved entirely possible. So we wait for $100k then ;)
And yes, realistically we can expect bear periods along the way as well.