How is Bitcoin holding in the broader perspective? (BITCOIN WEEKLY-Chart Analysis)

When charting and looking for the current trend that Bitcoin is in, my favorite timeframe is the weekly chart. The monthly is cool too, but all I can see is the secular trend, and that's still as bullish as ever.
But back to the weekly chart, how are we doing, where are we standing, and is this goddamn bear market finally over?
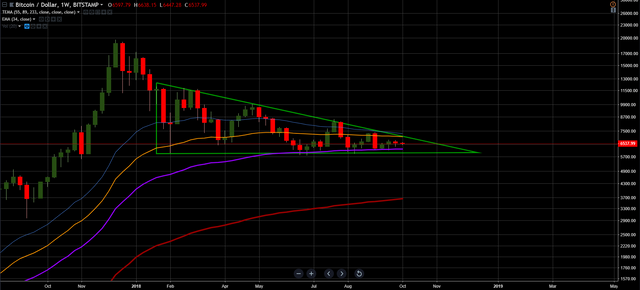
Well, my answer has to be somewhere between „I have no clue” and „It's still a bit to go”. Yes, I too have drawn the almighty triangle, simply because up till now it makes sense and has been a pretty reliable guide (with the benefit of hindsight) for the last 6 months. Sure, the exact angles could be adjusted a tad, but the result would be the same: we're nearing the apex. Now, when this happens in a descending triangle, sometimes it breaks up, but most of the times it breaks down.
I'm definitely not the fearmongering type, but since I'm doing TA I like to keep my head cool, prepare for any and every scenario and manage my risk accordingly. So let's see what happens if the worst were to be.
1. We break down
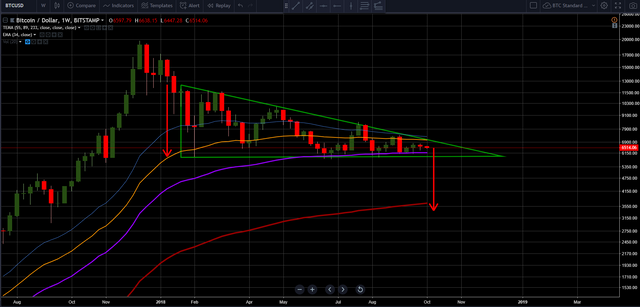
If we see that the triangle clearly breaks to the downside (preferably with some Daily candle retests on what was the bottom of the triangle), then the simplest way to estimate the target is to use its height. Thus we actually get a beautiful convergence with the 233EMA, which would provide a really strong support. But wait, there's more.
We zoom out:
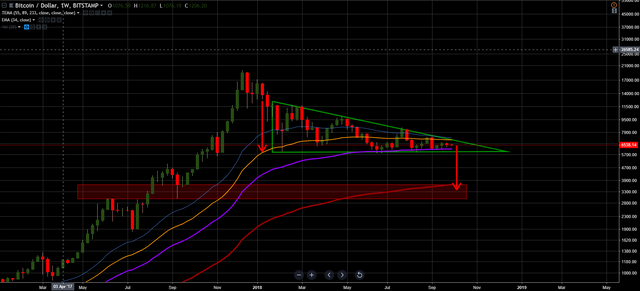
Now the picture becomes even clearer. Not only there would be a significant EMA, but the target would overlap a MASSIVE weekly support area. Roughly, we could be talking a Bitcoin of $3,000 up to $3,600. Surely, this is not a given. Nothing is in TA. But as I see it, it would be the lowest point to which we could go, if we break down. Personally, were we to collapse, I would expect a bottom of just $4,500-ish, which would overlap a previous consolidation area, as well as the 78.6% Fib retracement, of the run that started in 2015.
2. We break up, up, up
If we break to the upside, there's not much to talk about honestly. The bear market would be over. The bottom would have been confirmed as definitely IN. Once we'd have a higher high and a higher low on the weekly, volume should pick up and bulls would have control back for another 1-2 years. Still a way to go from all-time highs, but the wheels would be set in motion. Fingers crossed!