You are viewing a single comment's thread from:
RE: Do You Know Your Magic Number for Investing?
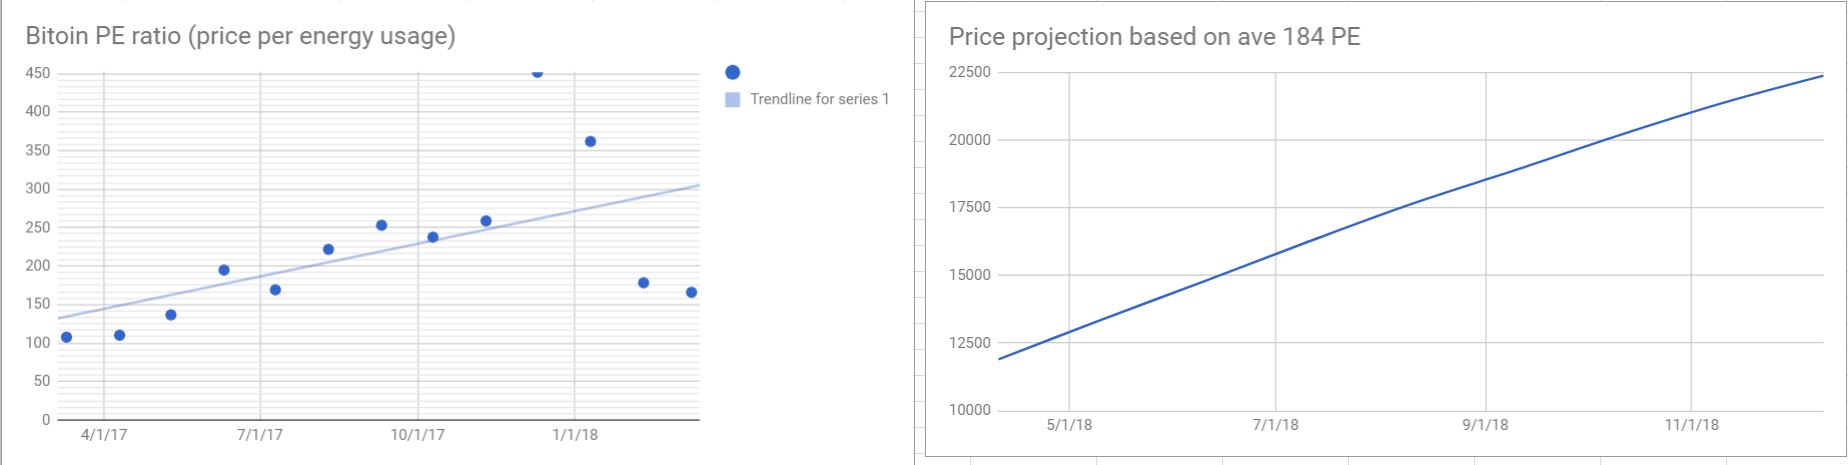
I spent a little bit of time and ploted this data manually on monthly time frame. First chart shows the bitcoin PE (price per energy) ratio for the past year. The second chart is price projection based on average PE ratio of 184 and energy usage estimates from link below. I've deleted the two highest PE points on dec 10 2017 and jan 10 2018 that were way outside of cluster . I'm not sure really if there's any meaning in this chart however i'll keep track of this statistic in future to see how close or off it'll be. Source for energy usage and energy usage projection: https://digiconomist.net/bitcoin-energy-consumption