BTC/USD in depth Analysis
Update on the EW count recently posted about 3 days ago.
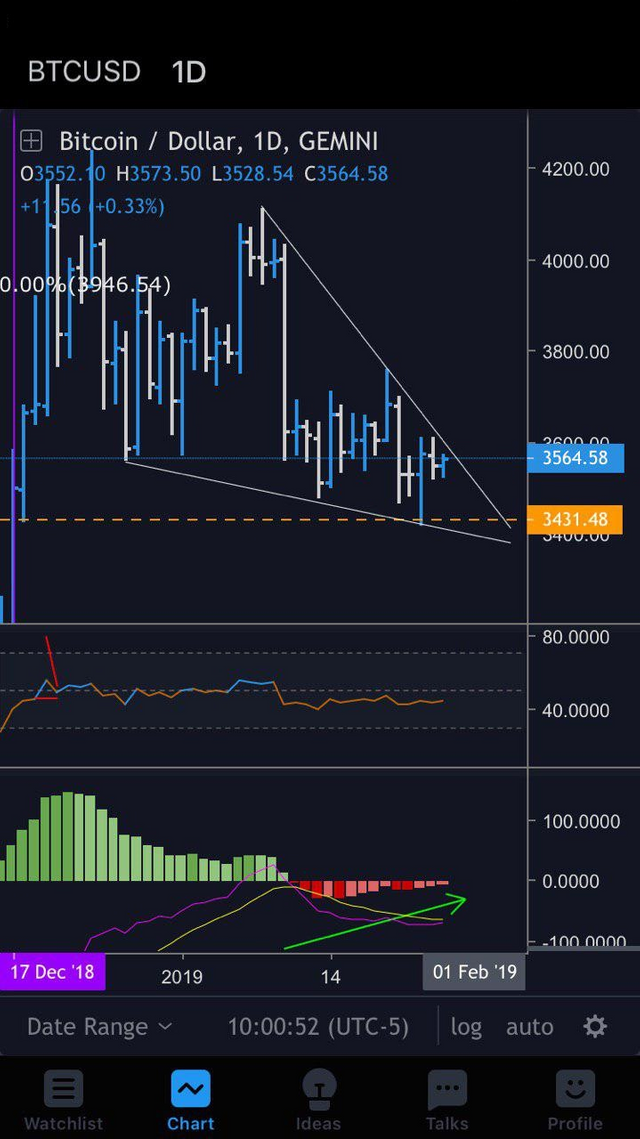
We got a nice wick to fill the orders placed in the target box. Fortunately, the bulls defending that level pretty nicely and it was pushed back up 5-6% from the bottom. Since then we have seen some sideways action without much volatility. Overall, the count is still valid and looks great in my opinion. To add to this, I have found a couple other supporting arguments for why we may see a big push up soon. First, I will post the updated chart with the EW count showing the wick into the target zone and the action following that.
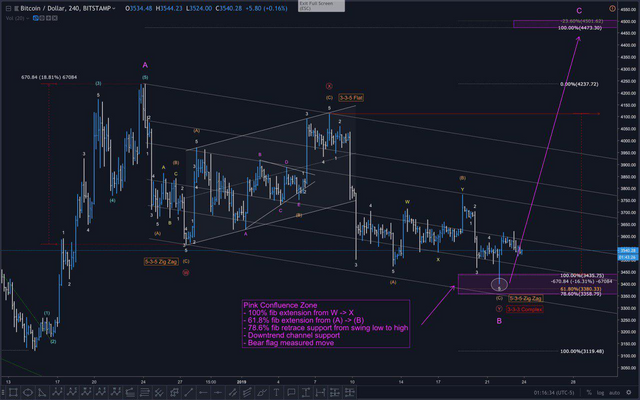
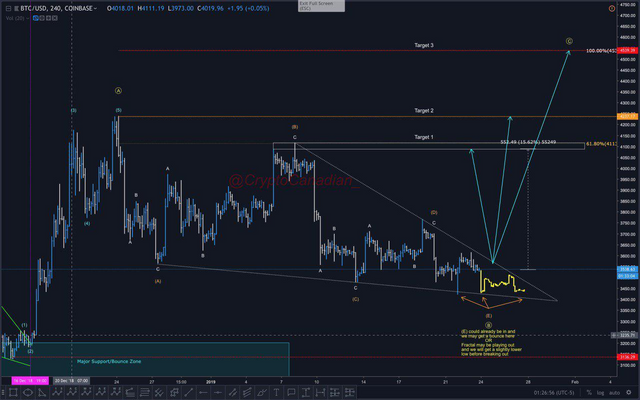
Now there are a couple other things I have spotted that seem pretty bullish to me. To begin, I will provide my secondary count for EW incase the WXY correction is not right. The second potential count I have is an ABCDE forming the larger degree B wave where we will see a breakout to the upside attempting to form the larger C wave. Now, for the non-EW traders, many people would just see this as a falling wedge. To trade a falling wedge we would wait for a successful close above the downtrend resistance of the wedge. This pattern would have a measured move target of roughly $550 (15% gain). Whereas, C wave has a target of $4200-$4500 depending on the strength of the breakout + momentum gained by the bulls. Keep in mind we may have a very small lower low at some point by the end of the next week. (If we do not get a lower low by then, we should have already broken to the upside).
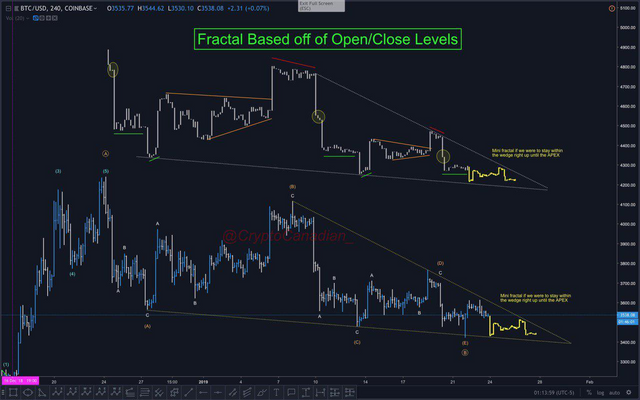
Now for the most interesting part of the analysis! Looking back throughout the previous wedge pattern that has been forming (B wave of the larger degree). I noticed that the price action looks very similar + repeated throughout the duration. Above the wedge, I have taken the price action of the open + close levels for each bar since the top of A wave. Now to walk through the pattern, it starts off with a steep drop consisting of 2 sideways moves (first is shorter than the second; white circle vs green horizontal line). Then we see the price start to diverge to the upside and then shoot up hard. From then, volume dies out and we begin to trend sideways once again but this time forming some sort of a triangle pattern before breaking to the upside again on decent volume. After this break, we see the price start to die out and diverge back down (red diagonal at top). Price then breaks minor support and has a sharp downfall before continuing the same sequence again.
Using this information I managed to shrink down the fractal pattern (in yellow) and fit it within the wedge pattern we have spotted and it fits perfect with the first bounce off support and then ride along resistance before breaking to the upside and eventually making a new pattern.
This is my first time using fractals in any of my analysis, im not a huge believer in fractals but they are pretty cool to spot and see how the future price will react different/similarly to it.
Looking deeper into the falling wedge and indicators on the 4hr + 1D chart it looks even better! Taking a look at the RSI, I see a clear triangle forming on the 4hr. A break above the resistance would result in a great push to the upside hopefully leading us into the overbought range. On the MACD we see divergence between the last 2 lows as well as another triangle setup where we should see a big move to whichever side we break out of.
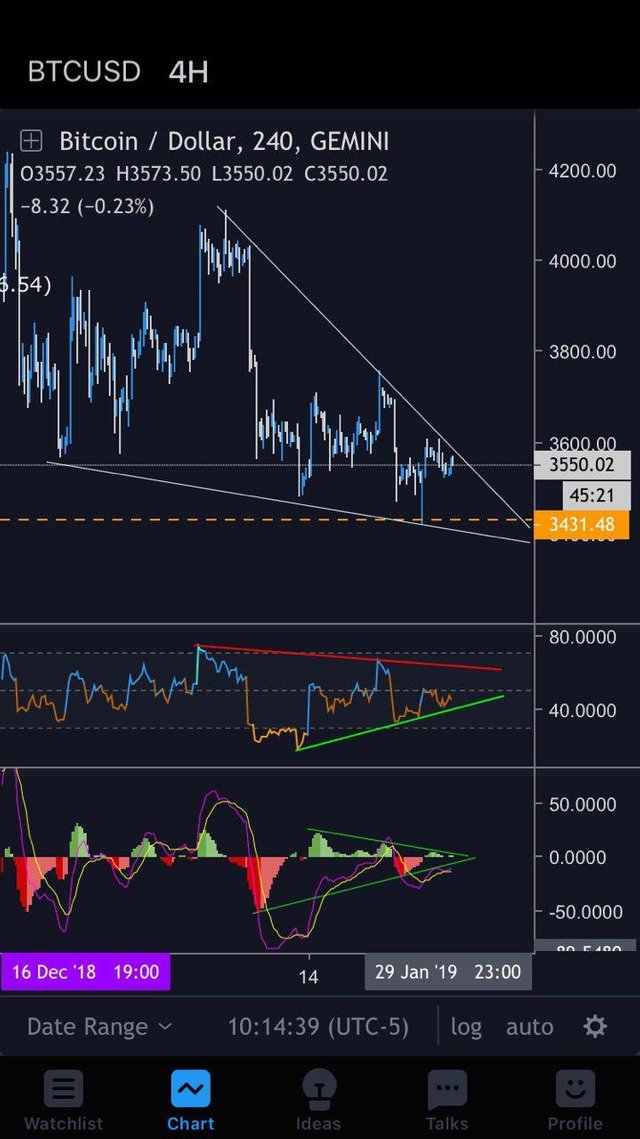
Daily chart also showing a small bit of bullish divergence. Also seems like the MACD + Signal are looking to cross bullish soon.
This is not financial advice. I don’t take into account of your personal investment objectives, specific investment goals, specific needs or financial situation and makes no representation and assumes no liability to the accuracy or completeness of the information provided here. The information and publications are not intended to be and do not constitute financial advice, investment advice, trading advice or any other advice or recommendation. Any expression of opinion (which may be subject to change without notice) is personal to the author and the author makes no guarantee of any sort regarding accuracy or completeness of any information or analysis supplied.

Congratulations @viperblckz! You have completed the following achievement on the Steem blockchain and have been rewarded with new badge(s) :
Click here to view your Board
If you no longer want to receive notifications, reply to this comment with the word
STOP