Trading Strategy 101 – Support and Resistance Zones Strategy Guide

If you are into trading, you have probably heard of the words “support” and “resistance”. The support and resistance is commonly used by analysts when doing a technical analysis on a market trend. But what is support and resistance? How is it used and how do you know where the support and resistance is?
This article will focus on the support and resistance of a market trend. At the end of this article, you will learn:
a) What support and resistance is.
b) How to locate where the support and resistance is.
c) How to apply the support and resistance in your trading strategy.
Now let's begin by defining what support and resistance is.
The support and resistance is the limiting barrier in a market trend which stops the downward or upward movement of the trend. The support acts as the floor and the resistance acts as the ceiling.
Below are charts showing the support and resistance.

Fig. 1. Chart showing support line

Fig. 2. Chart showing resistance line
Both are formed through the actions of the traders in the current market. The decisions to buy or to sell are made by analyzing the current price against previous areas which cause an emotional response to traders. They fear of missing out of on opportunity so they either buy or sell at these areas of support or resistance.
To put it simply, resistance is where traders place their selling point and support is where they place their buying point. That is where a barrier is formed.

Fig. 3. Book order chart showing resistance barrier
Sometimes support and resistance isn’t exactly a straight line. This is called an area or zone. What happens here is that traders may adjust their prices depending on their outlook of the trend.
Never assume that the support or resistance will hold for long. You should always suspect a reversal at support and resistance as there is a high probability that price action will reverse at those key levels.
Now we know what support and resistance is and how to look for it, let’s know proceed on how to apply support and resistance in trading.
The first step in this strategy is to locate the support and resistance and drawing it in the chart so that we can easily spot where the price would probably reverse.
We begin by drawing horizontal lines on recent Peaks and Bottoms like you see below in our chart example: Examine this chart as it is critical for you to understand these zones.

Fig. 4. Chart example
Take note that the more touches to the line is, the far better off it is as it is clear that is has stood against the price and passed the test for many times and it will probably continue to do so. This is because more and more investor tends to place their buy and sell in the support and resistance zones.
After you have identified the support and resistance zones, the next step is waiting for the price action to touch the support resistance zone so what you can do is set your charts on 2 to 4 currencies and wait for your chance as it may take some time for the price to reach the support resistance levels. The reason I say 2 to 4 currencies is because this is a good number of pairs compare as most cryptocurrency moves in the same pattern.
Basically, the higher time frame takes less time and attention than the smaller time frame because the smaller time frame has more signals. Thus, the zones may get hit more frequently so you have to be more focused if you’re trading small time frames.
The third step of this strategy is to wait for the candle which hits a zone to bounce. We will then analyse the characteristics of the candle. Is the candle bullish or bearish? Is it strong or weak? Big or small? Does it have long or short wicks or no wicks at all? Spotting that specific candle on zones make the difference between winning trades and losing trades.
The qualities of a candle we are looking for are:
a) Long body
b) Formed after the previous candle touched the level but could not break it
c) Entirely longer than the previous candle

Fig. 5. Bearish candle example
The example above shows us how a strong candle should look like as we see how the strong candle over power the one before.
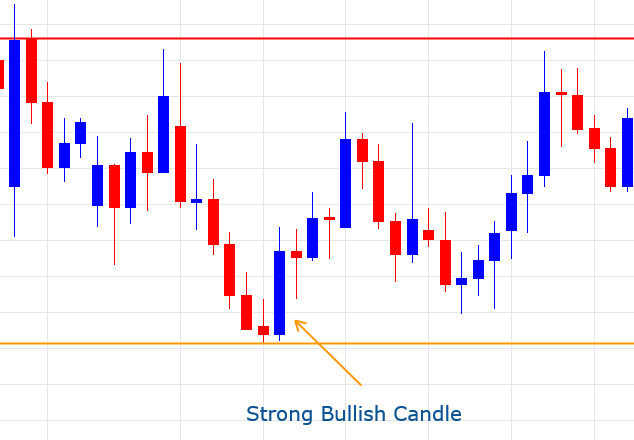
Fig. 6. Bullish candle example
In the chart above, we see how the support rejected the price and bounced back the candle. The upward candle formed a long body which indicates that it is a strong bullish candle.

Fig. 7. Candles example
Here, you can see that those weak candles were not able to breach the resistance line and had long wicks and could not break that level so we wait to see what will happen with the next candle will the price action break that level or will the resistance win and the price reverses.

Fig. 8. Price fell below resistance
On this chart, it clearly shows the price fell on the next candle which made it a valid reversal.

Fig. 9. Price rise above support
In the chart above, it shows that at the bottom near the support zone, we had a very small candle which did not mean anything except that the resistance stalled the price for a while.
Now we have set-up everything that you need to learn, we will now proceed to the fourth and last step.
The fourth and last step is where you will place your buy and sell and is the easiest part
Your buy point should be slightly below or above the strong bullish candle that breached the resistance zone. This way you are adding more confirmation to your trade to make sure that the price will move towards the direction you expected it to move to. The stop-loss is just the opposite; you should place the sell point slightly above or below the strong bearish candle. Putting the stop-loss there marks the end of the trade as the price is unlikely to go up for some time after that point.
To visualize it, below is a sample of what we are aiming for.

Fig. 10. Profit zone
That ends the guide and I hope that you have learned something valuable from this post. If you have any question or anything that you wish to clarify, feel free to comment it down.
Disclaimer
This post is not a professional guide nor do I claim it to be. I just want to share my knowledge to my fellow crypto traders; hoping that this will help them broaden their knowledge in crypto trading. The original source material of this strategy is from Support and Resistance Zones Strategy Guide.
Previous posts you may like
Bitcoin Transaction Fee and Speed - January 30, 2018
Trading Strategy 101 – Easiest Bitcoin Trading Strategy
Crypto Guide for Dummies - Avoiding Beginner's Mistake

If you liked this post or it helped you in any way, please upvote, follow, and resteem so that more people can learn about this information! Thank you!