How can positions be taken for bitcoin in 2018?

The price of bitcoin rose to $ 20,000 last year, starting at $ 966. Even after the volatility of the last few days, he has made a big difference in all the other asset classes. But everyone has the big question in mind: what will happen in 2018 and how to trade Bitcoin?
Experts differ according to their opinion. Aggressive bulls set targets on $ 60,000 for 2018. This target is 300% higher than current levels. On the other hand, skeptics still say that the evaluation of crypto currencies is still a bubble.
Some are expecting wild waves in 2018. Saxo Bank predicted the price of Bitcoin would drop to $ 1000 after a possible $ 60,000 rise. Similarly, cryptopter entrepreneur Julian Hosp believes that Bitcoin will fall to $ 5,000. But he still thinks the price will touch $ 60,000. But Bitcoin is not sure what price it will reach before.
It's hard to know which one will be true when estimates tell us different opinions. So, we tried to identify a few unique charts that were repeated in 2017. These charts can be used as a guide by traders to develop a strategy for 2018.
50 Days Simple Moving Average
In 2017, the 50 Day Simple Moving Average (SMA) moved with critical support points. As you can see in the chart, Bitcoin has fallen below this level only four times.
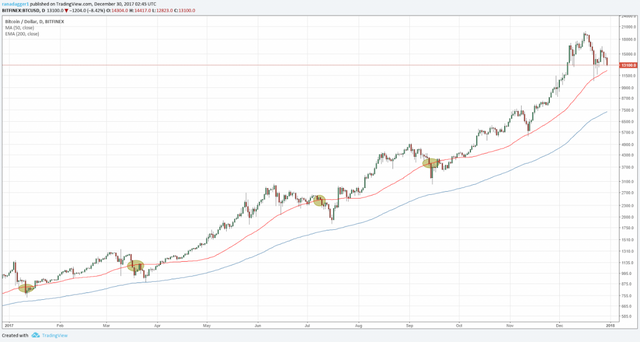
In all other cases, the price has picked up quickly, even though it touched the moving average. Therefore, a purchase close to the 50-day SMA offers a low-risk purchasing opportunity. It can be purchased with a stop-loss near the 50-day SMA
200-day EMA drop as a long-term entry opportunity
Bitcoin has provided low-risk access to traders who have long-term plans in 2017. In addition, the price we went through increased 20 times. Has not been traded under the 200 day exponential average (EMA) since October 2015.
In 2017, crypto money transactions were strikingly far from the 200-day EMA when it fell below the 50-day SMA. This opportunity proves to be an excellent purchasing opportunity for long-term investors. Even in the coming autumn, a move closer to the 200-day EMA should be seen as a buying opportunity.
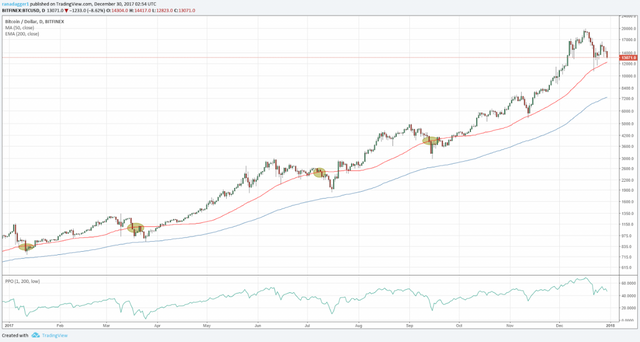
Bitcoin price will not fall to 200 day EMA even during a major correction. For example, on January 12, it remained about 6.5% above the 200-day EMA. Similarly, on March 25th, it took about 2.5 percent above the 200-day EMA. On July 16, the dip constituted 10.7 percent of the 200-day EMA.
Investors can sell up to 15% of the 200-day EMA, although they are not perfect, under which ordinary purchases can be made.
How do we calculate how much more than the 200-day EMA price?
Although there is no specific indicator for this, you can use "Price Oscillator" (PPO) values wisely. PPO presents the percentage difference between exponential moving averages. For this reason, if we need to determine how far the price is 200 EMA, we can feed 1,200 values; this gives us the desired result.
What if Bitcoin drops below the 200-day EMA?
If the price falls below the long-term moving average, this is a warning signal that something has changed. It shows that Bitcoin entered a long-term downtrend or entered an activity that required us to set a different trading strategy.
Trading profits are made by buying and selling at an appropriate time. We have set a low-risk purchasing strategy, but we have not yet determined the best time to sell.
Find the best place to sell bitcoin
There was no indication of a consistent sales signal at the top. A simple trend line, however, shows that it does its job perfectly.
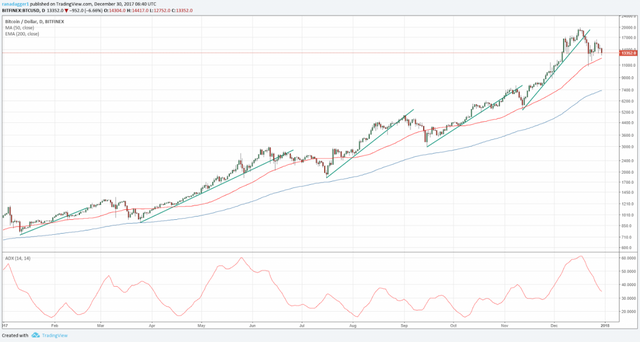
As you can see above, a break and closeness below the trend line did not remove you from the top position, but it certainly helped to lock most of the gains.
Another indicator that can help is ADX.
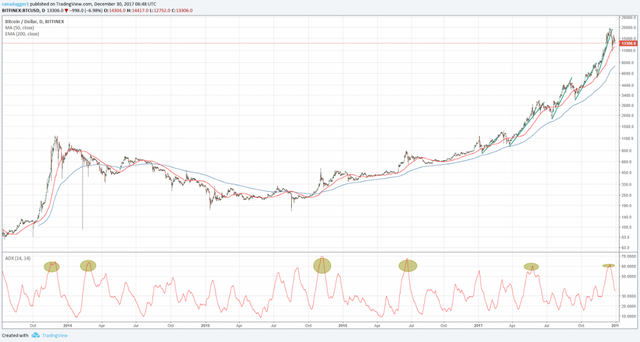
Even by 2014, over 60 readings on the ADX have been a good selling point for Bitcoin.
How should Bitcoin trade be approached in 2018?
It is easy to define and follow trends and trend lines after the graph is formed. But doing the same with live markets is not an easy task. In general, it is almost impossible to predict the net price movements of crypto money. To minimize risks, you can make long-term plans instead of short-term plans.

RESPECT FOR LABOR PLEASE
VOTE PLEASE
hey check out my post on tai lopez and upvote ..ty
Help me pliss upvote from @uzay
Its very hard to set target now a days.
Day by day its getting tough to analize the crypo