BTC/USD update - technical analysis - breaking down to ~7,500 USD/BTC - Next support?
BTC/USD break down
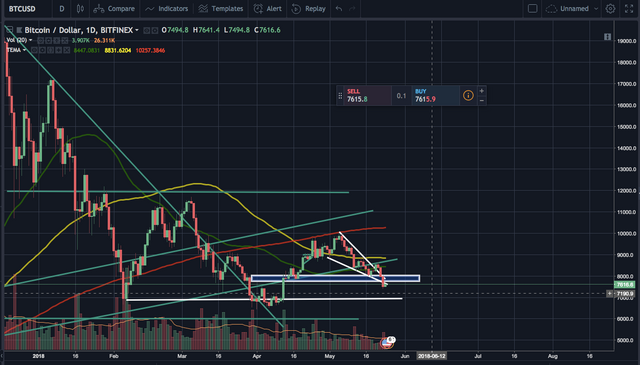
BTC/USD failed to break out upward from the falling wedge that was previously discussed. A lack of buying volume clearly contributed to it. The break out was not sustainable due to the depleting volume and a throw back occurred. Then, the price just went through both the upper and lower support lines of the falling wedge (and the 7,800 - 8,000 USD/BTC support level as well) without bouncing back. That really showed the buying side action didn't happen.
So, what't next? Where is the next support level?
There are multiple support levels that should be mentioned.
1) Daily chart support level ~$6,500 - $7,000
BTC/USD chart already made two bottoms in Feb and Apr around ~$6,500 and it's totally possible that another bottom is formed (triple bottom formation).

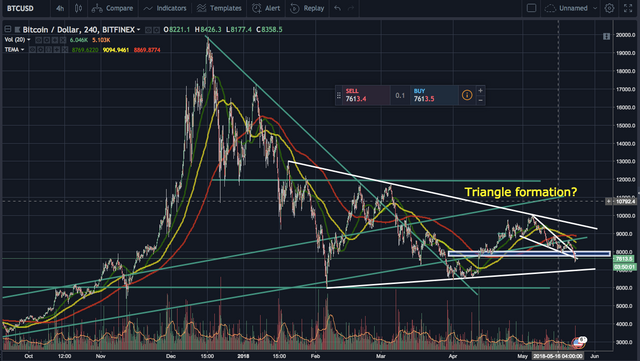
2) 4h chart - triangle formation?
BTC/USD may be forming a triangle and you can see that in the 4h chart. If the lower support trend line works, then the support level is ~$7,000 -$7,200 depending on how fast the price goes down.

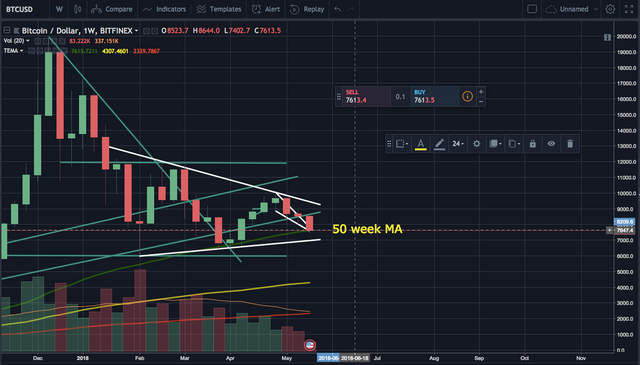
3) Weekly chart - 50 week moving average as support ~$7,600
50 week moving average worked before when the 2nd bottom was formed in Apr. The price is currently holding above the 50 MA so it could work as support again this time.

Please upvote and follow me if you like the post.
Where I trade : Binance
Follow me on Twitter : Twitter
Disclaimer : I am not a certified financial advisor. This post is just my personal opinion and not financial advice. Please do your own research and do not trade just based on my posts.