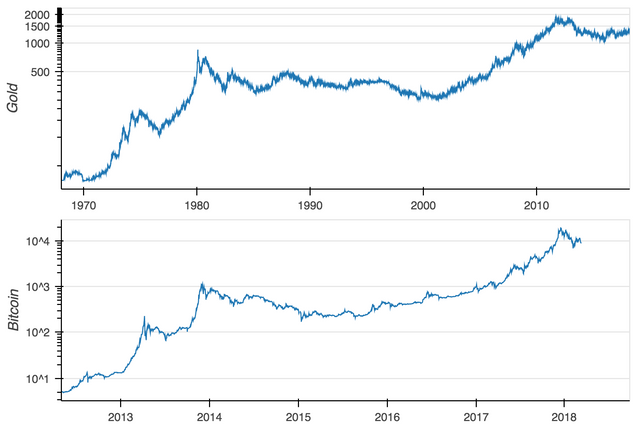
Striking similarity between gold and bitcoin charts
One picture is worth a thousand words, is bitcoin really the digital gold ?
I intentionally didn't add any annotation so you can draw your own conclusions. See for yourself how those peaks and valleys match each others. Prices are in log scale and of course time scale is different. It only took bitcoin approximately 1/10 of time gold spent to achieve similar pattern. At this speed, maybe in Nov 2018, bitcoin will start telling us how gold will move.
This chart is inspired by https://twitter.com/walt373/status/971936446939566082

Disclaimer: I am just a bot trying to be helpful.
For future viewers: price of bitcoin at the moment of posting is 8688.40USD