Bitcoin With A 5 Wave Wedge With The Overthrow
The 5 wave wedge is a powerful pattern when fulfilled, but devastating when not.
The chart below is a 1 hr. chart showing the sucker punch when the price went below the support line, known as an overthrow.

The chart below is the 1 hr. chart zoomed out.
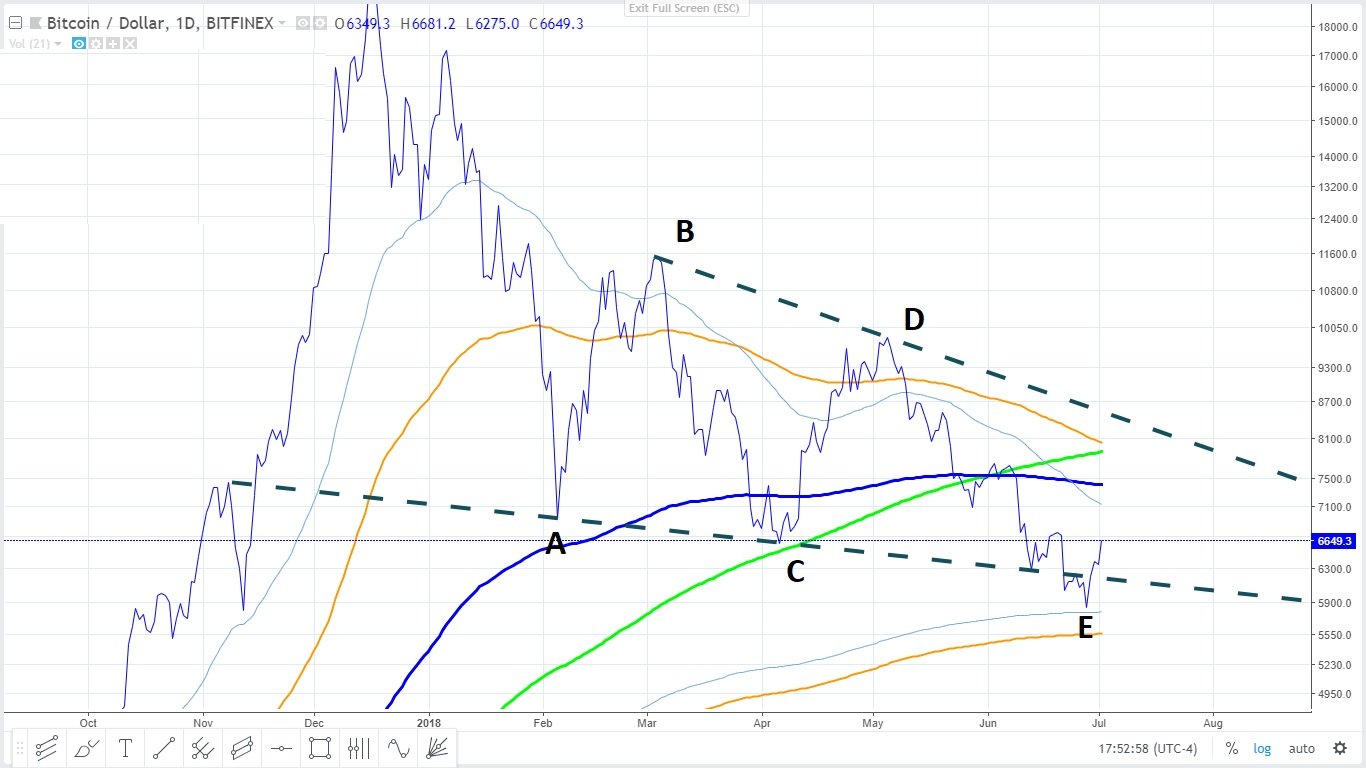
The chart below is a daily chart with the closing line chart, the dashed lines are linked with the pivot points and the pivots are denoted a-b-c-d-e. The pattern isn't confirmed until the the price closes above the wedge.
The chart below is a chart indicating all cryptos. Notice how the volume increases with price. The chart is wealth of information.

Ending......... Look back at the other posts. You'll understand that there's one more wave, meaning all time highs in the future.
All data and information provided is for informational purposes only. Trend Wizard makes no representations as to accuracy, completeness, currentness, suitability, or validity of any information in this post and will not be liable for any errors, omissions, or delays in this information or any losses, injuries, or damages arising from its display or use. All information is provided on an as-is basis. I document this stuff for personal reasons as a log and share with the community...... only because I'm a nice person.
So in ending........ Use critical thinking and think for yourself.
Just to clarify: do you mean the pattern confirms only with a close above the upper line of the wedge (~$8k)? Thanks!
yes the closing price is boss but remember the price can cluster too. A weekly / monthly close above holds more promise, nothing is 100% but increasing odds when closing price is above resistance.