Bitcoin And The 55 Week Moving Average
There's still a couple days yet before the end of the week but Bitcoin and the 55 week moving average have a relationship that goes back a few years.
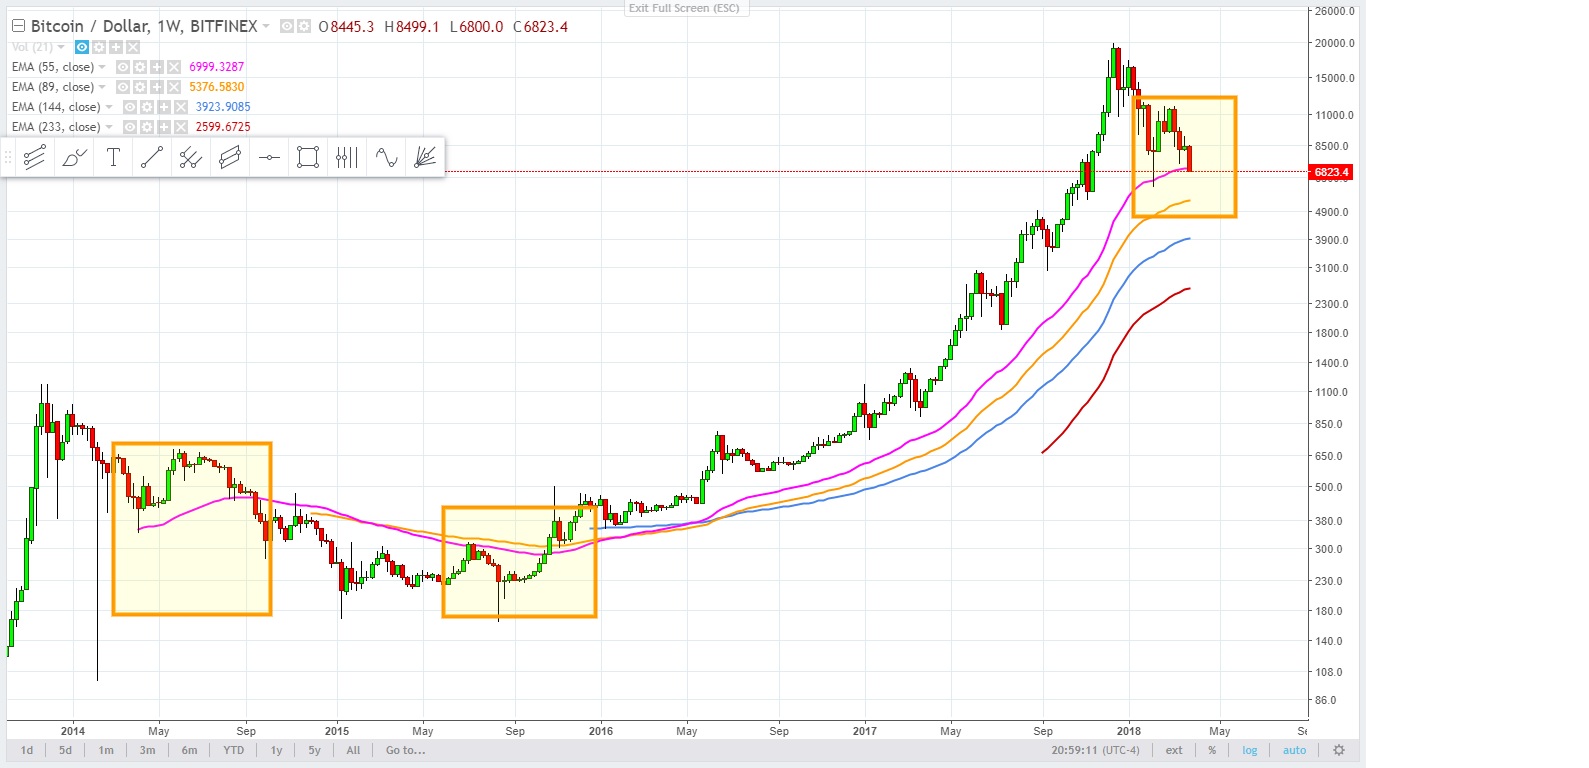
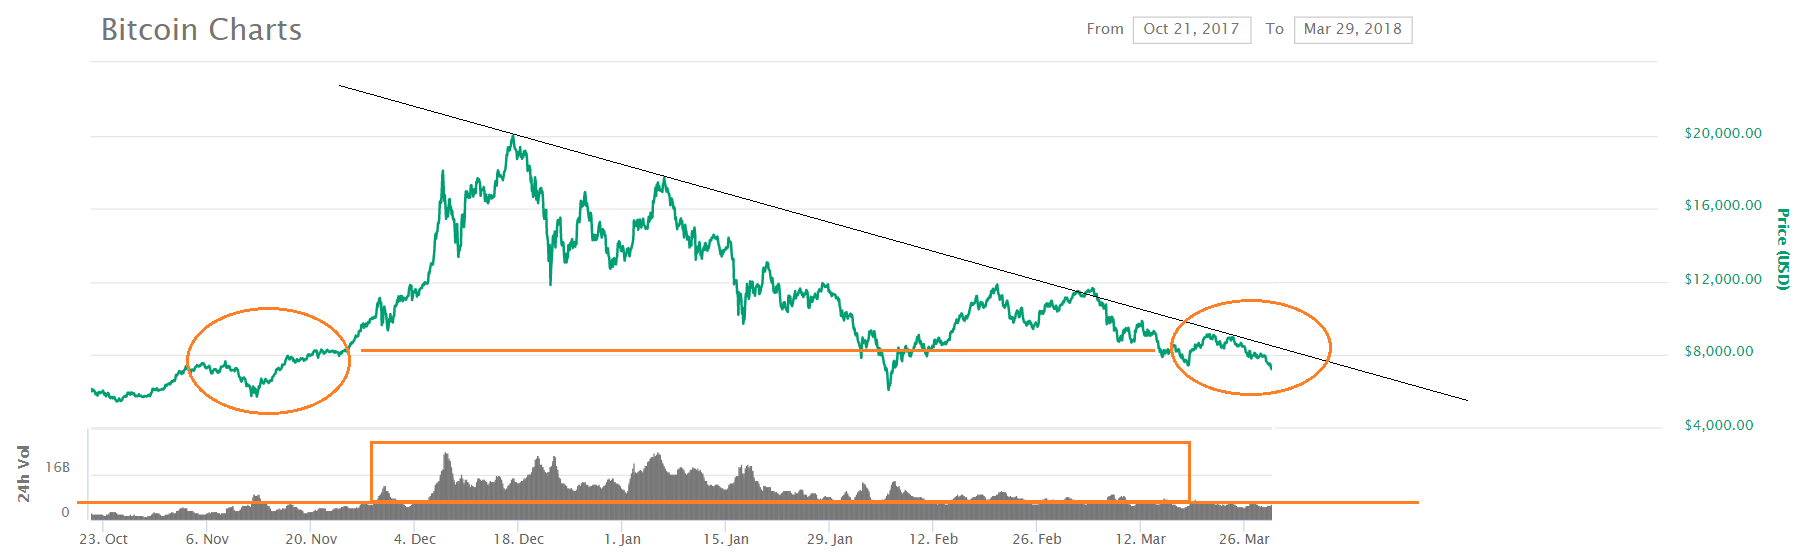
The weekly chart simple support and resistance with the 55 week moving average.
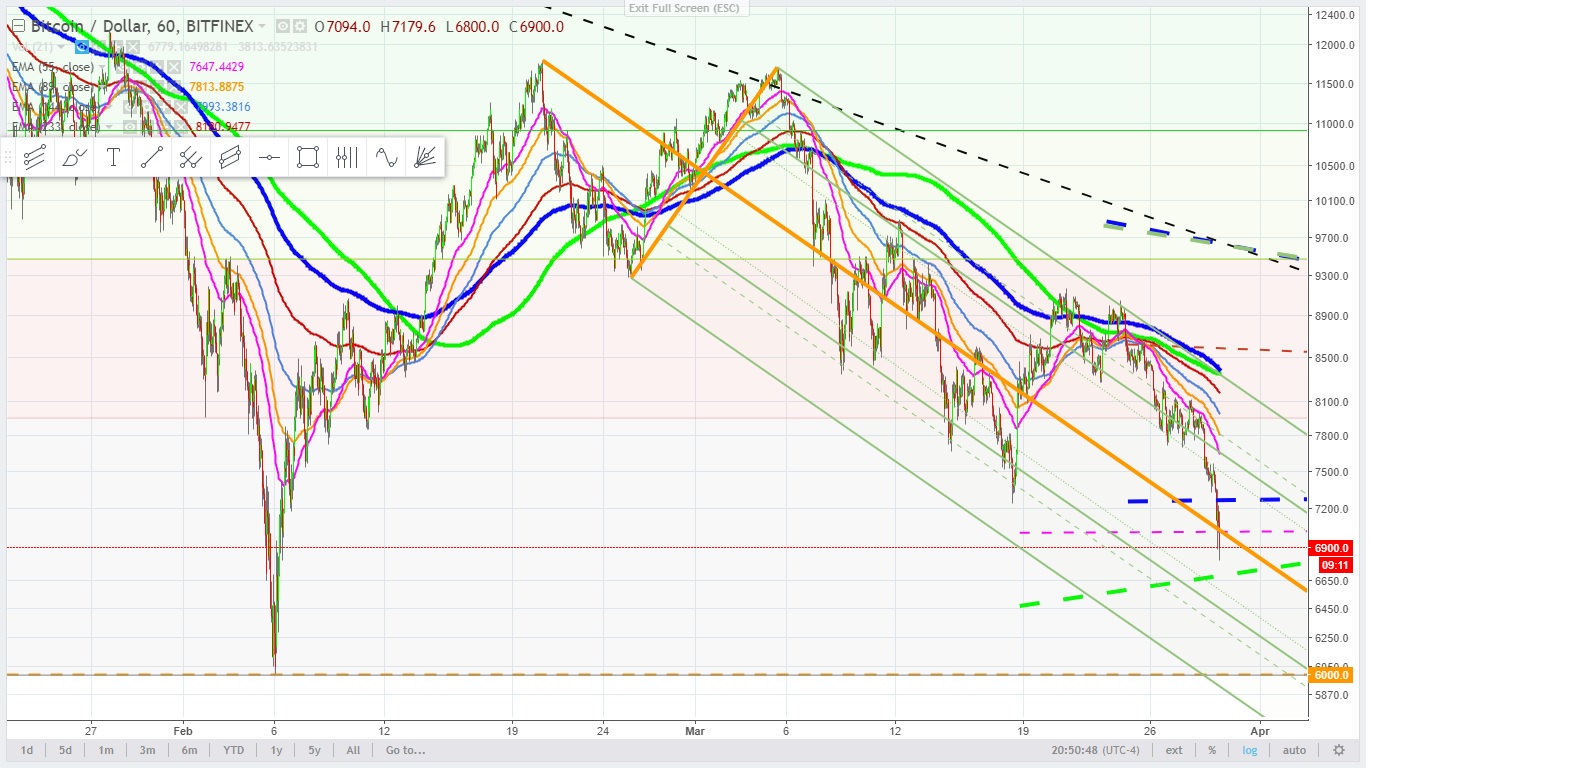
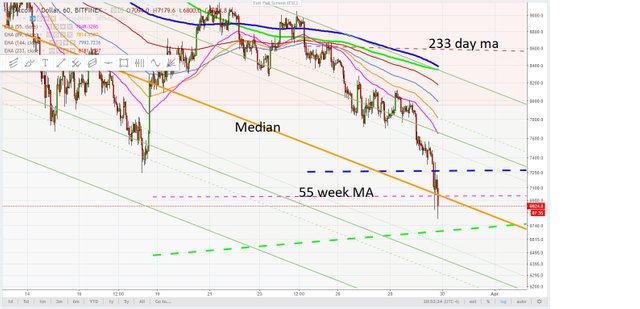
Then a couple 60 minute charts, I didn't put the count in but it's a broader ABC indicating a corrective wave. You can see the triangle formation between March 27th and 29th, A triangle can only be either a B wave in a corrective or wave 4 in an impulse. The price looks to be capitulating....... A little early to tell yet.
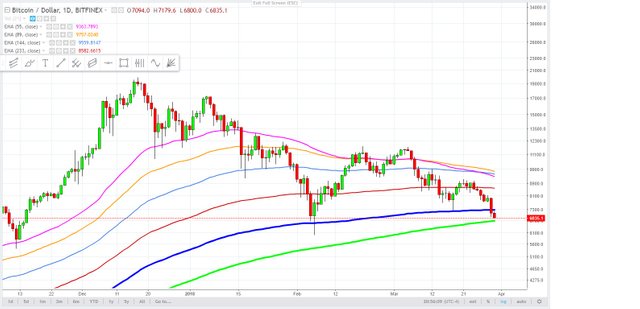
Then there's the chart with volume. We're back to the volume prior to the blow off.
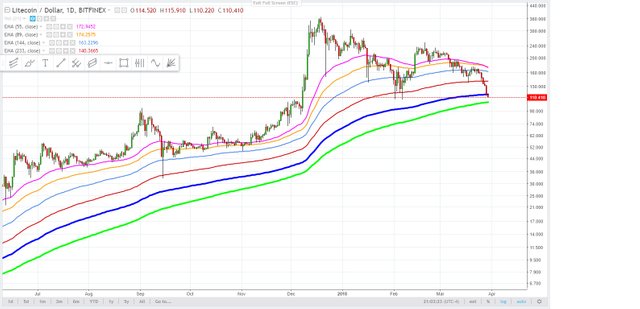
The last chart is Litecoin and is in sync as far as other cryptos go, at the same moving average area.
All data and information provided is for informational purposes only. Trend Wizard makes no representations as to accuracy, completeness, currentness, suitability, or validity of any information in this post and will not be liable for any errors, omissions, or delays in this information or any losses, injuries, or damages arising from its display or use. All information is provided on an as-is basis.