Bitcoin 15 Minute Chart Inside A Channel
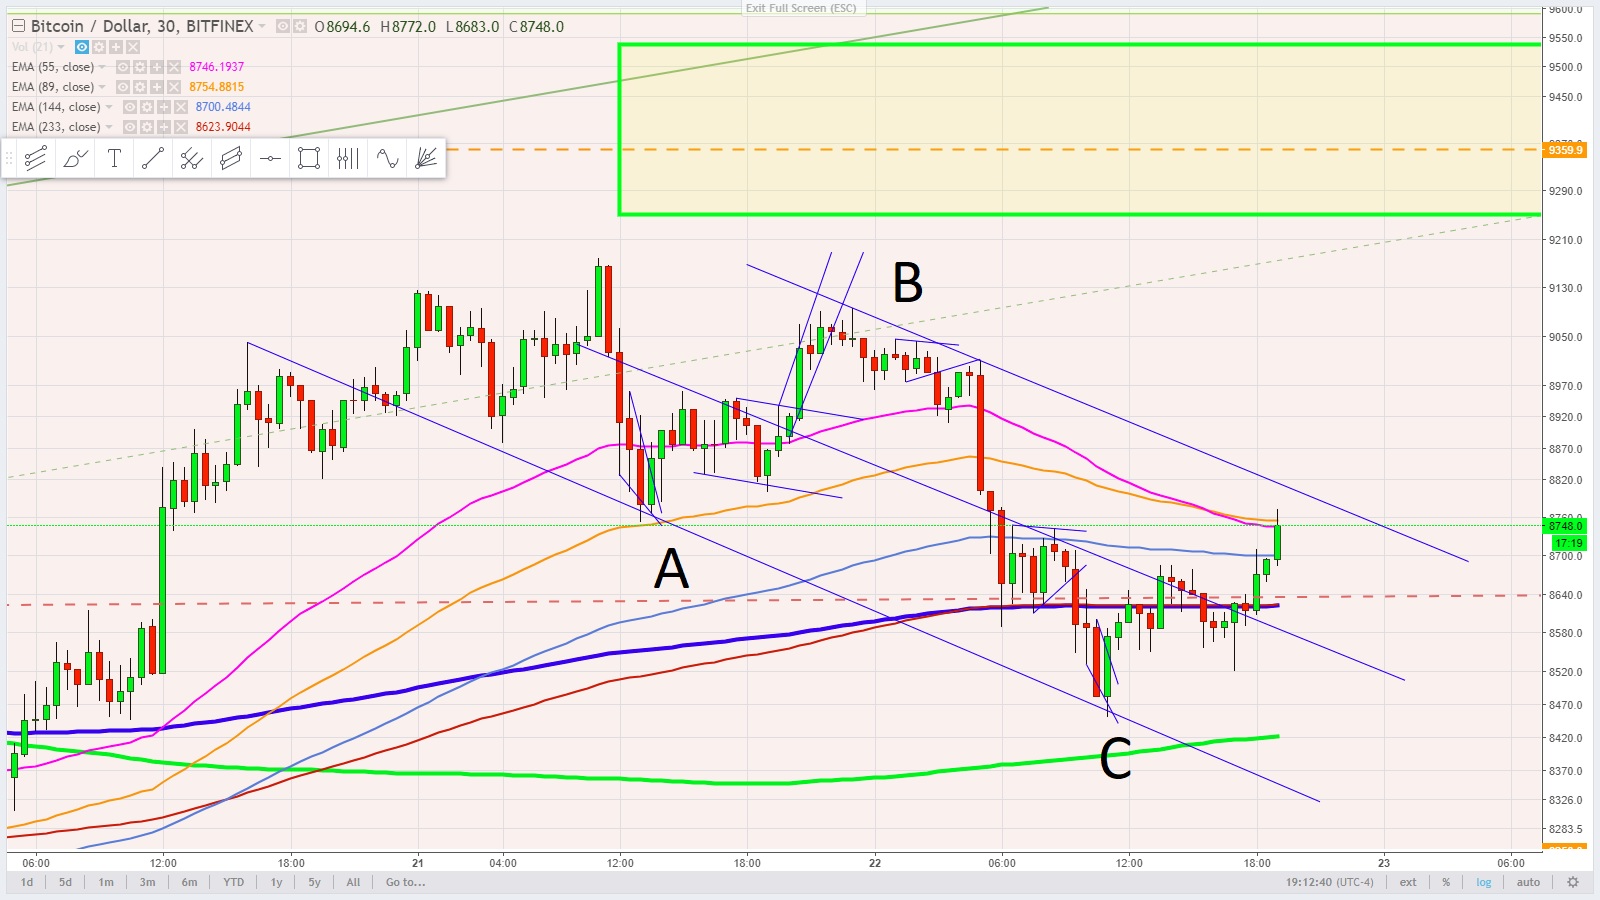
Earlier, an ABC corrective wave was indicated on the 3 minute. Expanding to the 15 minute chart the price should / could break out to the upside out of this channel. The red dotted line is the 233 day moving average.
Earlier post........ https://steemit.com/bitcoin/@trendwizard/a-corrective-wave-elliott-wave-count
correction........ 30 minute chart
All data and information provided is for informational purposes only. Trend Wizard makes no representations as to accuracy, completeness, currentness, suitability, or validity of any information in this post and will not be liable for any errors, omissions, or delays in this information or any losses, injuries, or damages arising from its display or use. All information is provided on an as-is basis.
Yea I had targeted $9,500 on the bounce...looks like we'll have to settle for $9,200. Reversal signals on the daily, grrrr. Nice analysis and post.
Thanks, could take some work to get through. Time will tell