Bear Market?: Cryptocurrency Market Fundamental and Technical Analysis
Throughout September, many of the top leaders in the cryptocurrency market, including Bitcoin, Litecoin, and Ethereum, have been on a consistent downtrend: experiencing significantly sized sell-offs every so often.
However, there are many fundamental factors that have lead to this, and in this article we will go over a few. Along with this, we will go through some technical chart analyzations so you can get a better idea of the current price movement occurring within the market.
Let us begin.
Fundamental Factor #1

In truth, I believe this months correction is almost perfectly summed up by a single word: China.
Chinese regulators had no mercy this month, as laws put in place banning ICO’s and domestic Bitcoin exchanges caused the cryptocurrency market to shed close to $90 billion in a matter of days.
Let us take a look at these regulations and determine the role they played in this months market correction.
1. ICO’s
On September 4th, news swepped the media that China had officially announced the illegalization of the rapidly growing ICO fundraising option.
As you can tell, this caused massive turbulence all over the market, and many of the cryptocurrencies centered around ICO’s and decentralized applications, such as Ethereum and NEO, almost immediately experienced significant sell-offs.
(September 4th charts below. Source: CoinMarketCap.com)
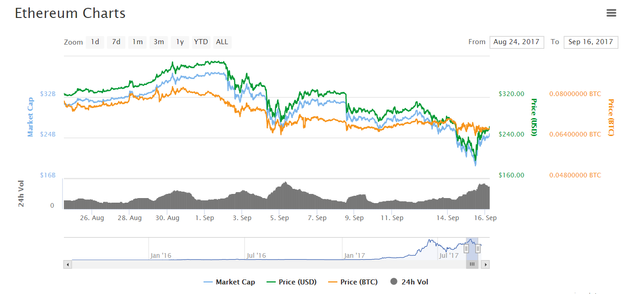
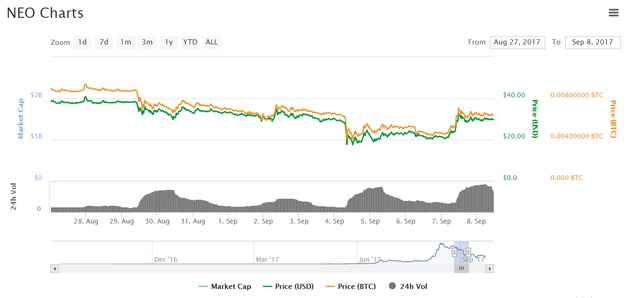
As you can see, as soon as the news of China banning ICO’s began spreading through online sources, sell-volume began to increase dramatically for Ethereum and NEO, and instant price corrections occurred.
Although this played a significant role in the month-long downtrend, it merely set a tone for what was to come in the following days.
1. Bitcoin Exchanges
A few weeks following China’s ICO ban, and as markets were seemingly in the process of recovery, things started to get a little bit uglier.
On September 15th, China reportedly announced an order for the complete and total shutdown of ALL Bitcoin exchanges within their borders.
As soon as this happened, even more panic and turmoil swept the market. Traders began fleeing, investors scrambled to liquidate their assets, speculators and critics began calling signs of an evident bear market: screaming all over the internet that the “bubble is about to pop!”
Without a doubt, the amount of pure FUD (fear, uncertainty, and doubt) within traders and investors that came from this was absolutely astonishing, once again proving the undeniably speculative nature of this market.
And while FUD-filled sell-offs have played a major role in causing the market’s current downtrend, they are not the primary reasons.
You see, due to the fact that China demanded all Bitcoin exchanges to be shutdown before the explicit date of September 30th, all domestic Chinese traders, along with institutional investors, were forced to completely liquidate all of their digital assets held in these exchanges: causing one of the largest sell-offs this market has ever experienced.
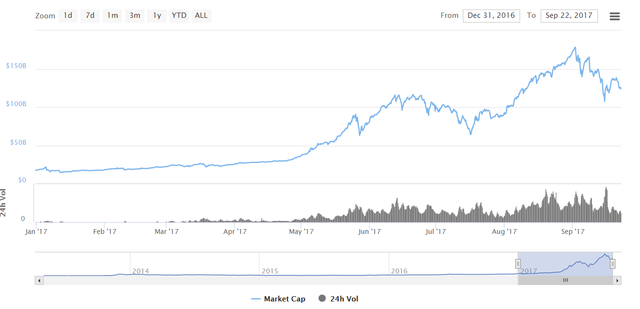
For this reason, along the tremendous amount of FUD being experienced by crypto traders and investors everywhere, the cryptocurrency market capitalization has been dealt a $50 billion blow so far this month, according to CoinMarketCap.com.
Therefore, as September continues to roll out, it still remains unsafe to say that the sell-offs are over. In fact, according to current market and price trends, it unfortunately seems that many cryptocurrencies, such as Bitcoin and Litecoin, are on the path toward substantial decrease.
Technical Chart Anlyzations
BTC/USD:
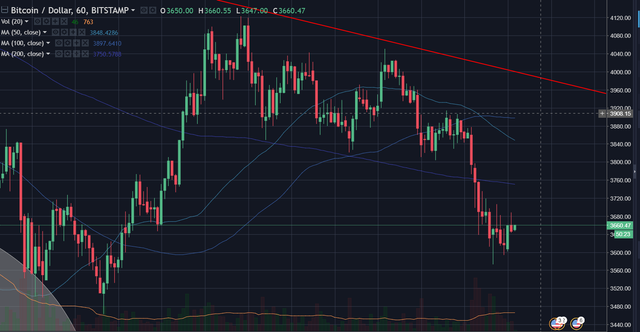
As you can see from the chart above focused on the hourly, the BTC/USD exchange rate exposed several bearish indicators, falling below the 50-, 100-, and 200-day Simple Moving Averages. This is one of the primary indicators used to catch price trends before they happen, and it seems almost clear that the BTC/USD price correction is far from over.
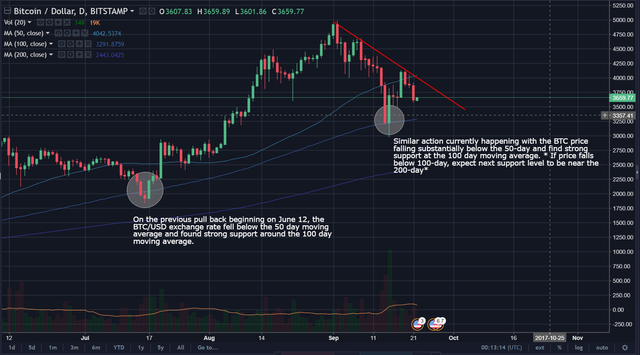
However, the BTC/USD daily chart doesnt look quite as bad, as it shows strong support around the 100-day moving average, similar to the trend movement that occurred during BTC’s price correction in July.
Nonetheless, September 30th, the day all Chinese Bitcoin exchanges are forced to shutdown operations, has yet to come. Therefore, dont be surprised if BTC continues to experience more sell-offs and price corrections.
LTC/USD:
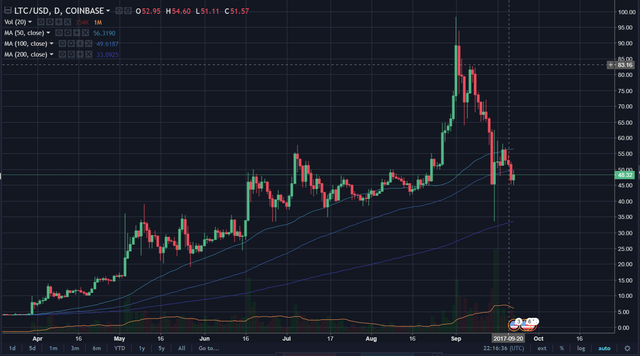
For the first time since its rally began, the LTC/USD exchange rate fell significantly below the 50- and 100-day moving averages on the daily chart. Although the fate of it is unclear, it almost clearly seems that Litecoin is heading for new lows as it makes its way to the 200-day moving average. While massive buy volume on September 20th suggests otherwise, indications strongly support the case that Litecoin is experiencing significant downward momentum that may not end here. If support cant be sustained near the 100-day, expect a steep downturn closer to the 200-day moving average, around $35-$40 USD.
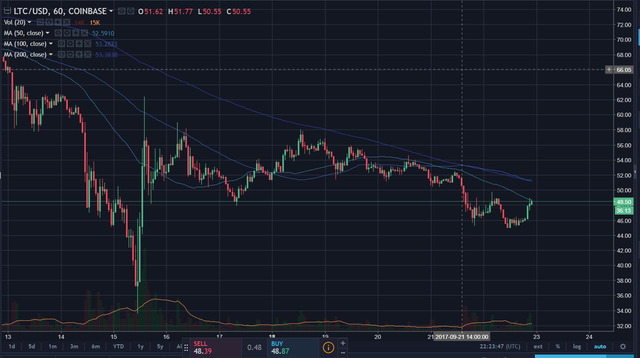
However, when looking at the hourly chart, the LTC/USD exchange rate fell significantly below all 3 moving averages, clearly indicating that the downtrend may not be over. But, it seems that it has regained slight upward momentum today (September 22nd) as it has met the 200-day SMA at the $48.50 price level.
In my opinion, continued price corrections are evident.
NEO/BTC:
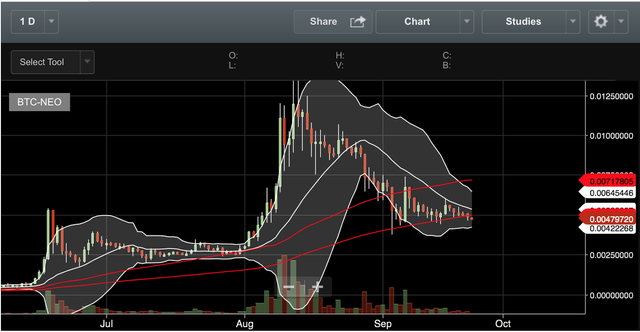
NEO’s price action, on the other hand, looks quite radically different. Similar to its previous trend, the NEO/BTC exchange rate flew to almost 0.0125 BTC during mid-August. Following this massive rally has been a more than one-month long price correction, with NEO’s price remaining quite stable at whats seems to be a solid resistance and low at 0.0048 BTC. Similar to NEO’s June-July price trend, the bollinger bands are closing in quite nicely, indicating a momentary pause of volatility as the price nears the 20-day moving average.
For these technical reasons, I am a firm believer that upward momentum is soon to come within NEO’s price action. As the bollinger bands tighten up more and more, and as the NEO/BTC exchange rate closes in towards the 20-day SMA, I believe what will follow is another sustained run-up, similar to previous trends.
Conclusion
Overall, it seems fair to say that the short-term future of the cryptocurrency market remains unclear.
As we near the September 30th deadline, the market may continue to experience more forced liquidations. As these sell-offs occur, if they do, the grandiosity of them will be multiplied as traders and investors everywhere will fear losses, follow the negative hype-cycle, and liquidate their assets as well: causing greater price corrections than expected.
I hope you enjoyed this article and I hope it gave you some clear insight as to whats currently going on in the cryptocurrency market. If you have any suggestions or comments, leave them down below as I welcome any and all feedback. Thank you for reading!
Follow @TheCoinEconomy on all social media platforms in order to receive the latest insight on the cryptocurrency market and advancement of blockchain tech. (TradingView, Twitter, Instagram, Facebook, StockTwits.)
Interesting post !
I also just wrote a similar article, would like to hear your opinion on it :)
Definitely! I'll take a look! Thank you for reading!