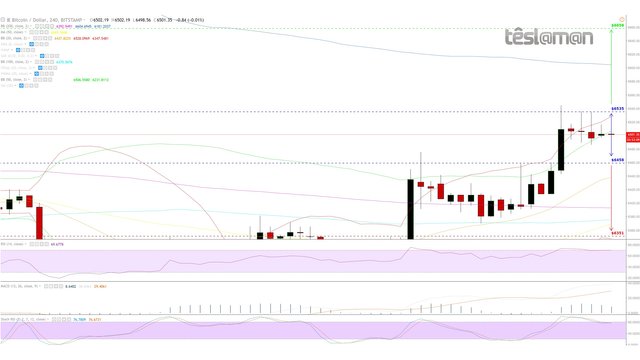
03 - 07 Nov 18 - Bitcoin Snapshot
4H Chart - Price Key Points:
03/11/18: 36Hrs consolidation.
04/11/18: Bullish breakout from $6341 formed a flagpole and a well structured bull flag.
05/11/18: Minor rejection at approx $6412 with average support set at $6378.
06/11/18: 200MA provided the required support for a buying attempt at approx $6398.
07/11/18: Bullish continuation at approx $6448.
RSI developing a slight negative divergence.
MACD and Stochastic RSI bullish.
Buying volume supportive.
Possible Scenarios:
Long: On a confirmed break above $6535 – Price Target $6658 | Probability: 40% | Signal Strength: 5/5
Neutral: Price Range $6458 - $6535
Short: On a confirmed break below $6458 – Price Target $6351 | Probability: 35% | Signal Strength: 3/5
Our Stance: Protecting long positions.
