You are viewing a single comment's thread from:
RE: Bitcoin Is Up For Grabs? Should I Buy or Quit and Sell All?
You did a good job,
On issue of going down of bitcoin and altcoin , what is going to be their result soon because i expected it to go up by now.
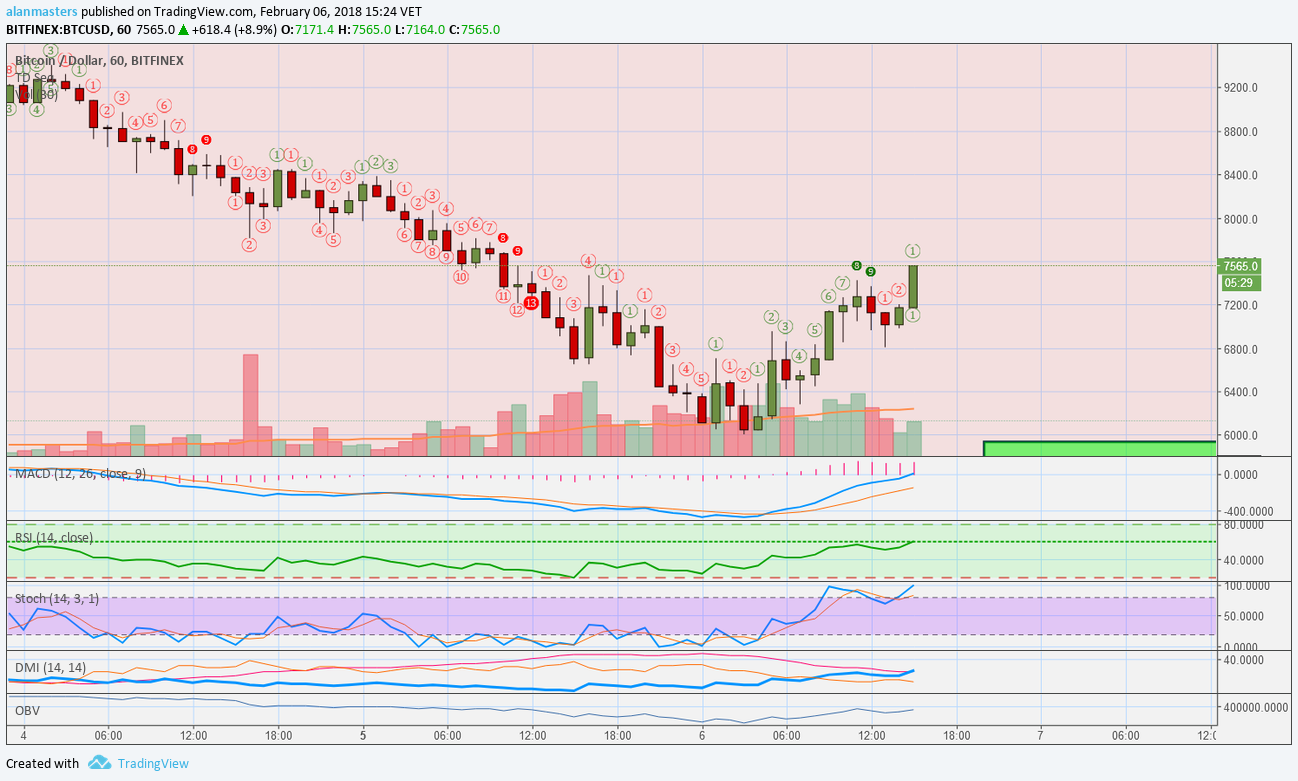
We are having a very strong bounce. The short term 1 hour and 2 hours charts time frame are looking strong. The low was $6,000, we are sitting at $7,500.
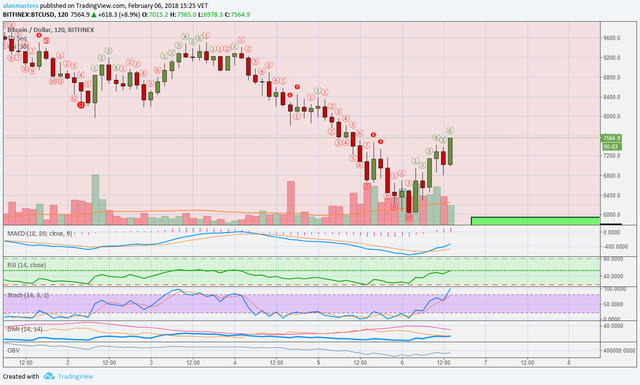
The longer time frames still need more time to develop and reflect this bounce that we are having just now, but the MACD on the 4h chart is also about to cross over trending up, with plenty of room for growth of course, since we are at the bottom of this correction that we have been enjoying.
Let's take a look at the charts just for the fun of it...
1h chart:
2h chart:
4h chart:
These are short term movements and signals, but it is always fun to post an update when Bitcoin goes up. :)
Please vote and resteem if you enjoy :)
Thank you for your support. The market will be here together once this process is complete.