BTC Analysis Feb. 12, 2018 - Bullish/Neutral But Resistance Not Far Away
Feb. 12, 2018 BTC Chart Analysis
Looking at the BTC charts (1hr, 4hr, daily, weekly) has me cautiously bullish to neutral. The short term charts (1hr, 4hr) have me feeling bullish but then when you look at the daily chart, it is clear to see we a stuck in a range with possible resistance points right above the current trading range
1hr BTC Chart Looking Bullish

https://www.tradingview.com/x/bLoZcmX5/
The 1hr is setting clear higher lows filling out the current wedge pattern. Based on this I think a break of the upper wedge line (red .236 retracement) is what the 1hr is looking like it wants to do
1 Day BTC Chart Cautiously Bullish / Neutral
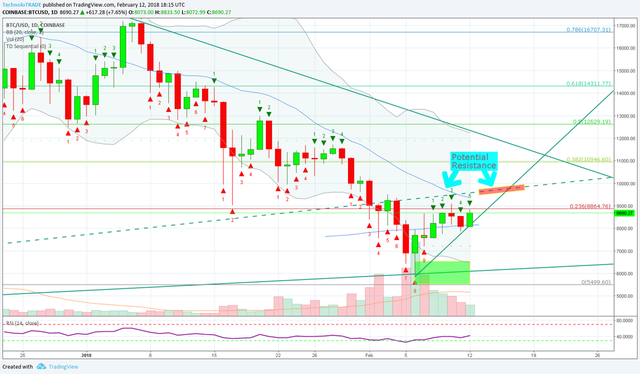
https://www.tradingview.com/x/ZTWJKKa7/
The 1 day BTC chart shows a different picture. Over the last couple of days BTC has been clearly in a range. Even if BTC does break to the upside, I see potential resistance points not far away.