Bitcoin Technical Analysis Report
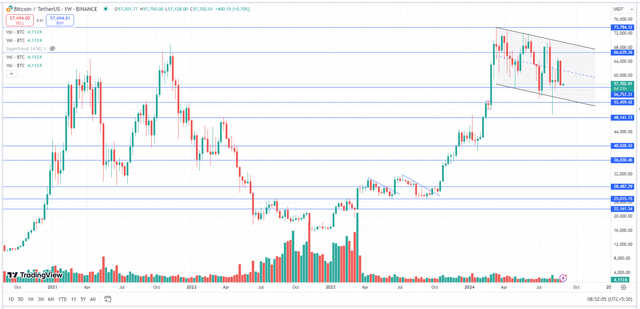
The price has faced significant selling pressure and is poised for a weekly decrease exceeding 9%. Over the past several months, Bitcoin has repeatedly established lower highs, indicating a bearish trend. This situation places the responsibility on the bulls to uphold critical support levels.
Concurrently, the markets are looking forward to a significant catalyst, namely a possible interest rate reduction by the U.S. Federal Reserve in September.
As of the current moment, BTC is trading at $57,702.

Over the past three weeks, Bitcoin has been trading within a broad range of $56,000 to $65,000, exhibiting sideways movement accompanied by low trading volumes. An analysis of the weekly chart indicates that the asset is attempting to form a 'Bullish Flag' pattern. Additionally, Bitcoin has faced challenges in maintaining a weekly close above the $70,000 threshold. For a significant rally to occur, it is essential for the asset to break out of this pattern with substantial volume and to sustain prices above $70,000. The asset encounters strong resistance at $66,500, while $56,000 and $52,500 serve as robust support levels.
"Great analysis as always! 🤓💡 The possibilities for Bitcoin's future are indeed intriguing, especially with the potential interest rate reduction on the horizon! 🔥 It's exciting to think about what this could mean for the asset's price and overall market dynamics. 💸 I love how you've broken down the current situation, highlighting both the challenges and opportunities ahead. 📊 Your insights have me curious - do you think Bitcoin has what it takes to break out of its 'Bullish Flag' pattern? Share your thoughts! 😄 And don't forget to vote for xpilar.witness by heading over to https://steemitwallet.com/~witnesses and show some love for this awesome community! 🙏"