Bitcoin price today - litttle shows bullish run
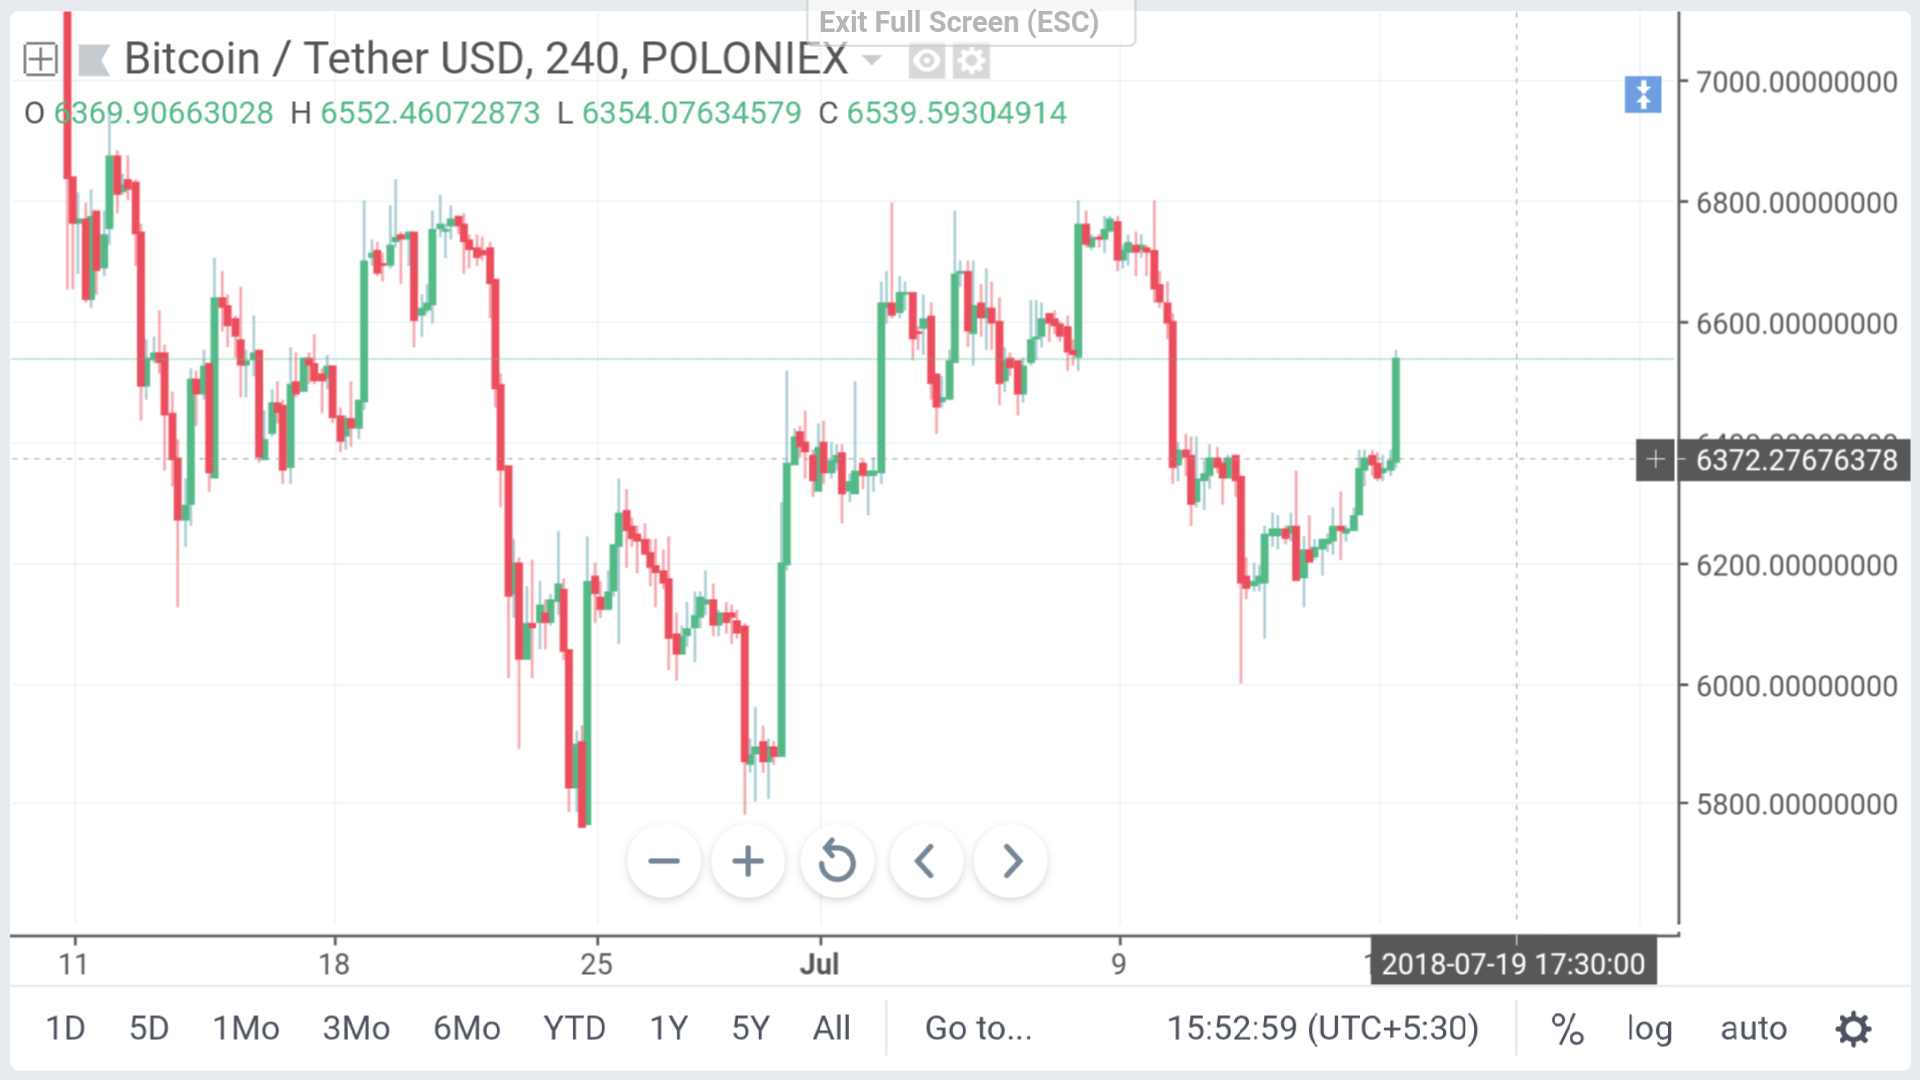
Bitcoin chart shows that little bullish.
- Here 4 hour bitcoin chart, we can see that Bitcoin making some support or background for upside motion, Bitcoin making support to it's price.
- $6039 after that Bitcoin try to make $6800 that is making another support level if we reach that.
- If it break level $6800 than upside relly we can see that is up to $7500.
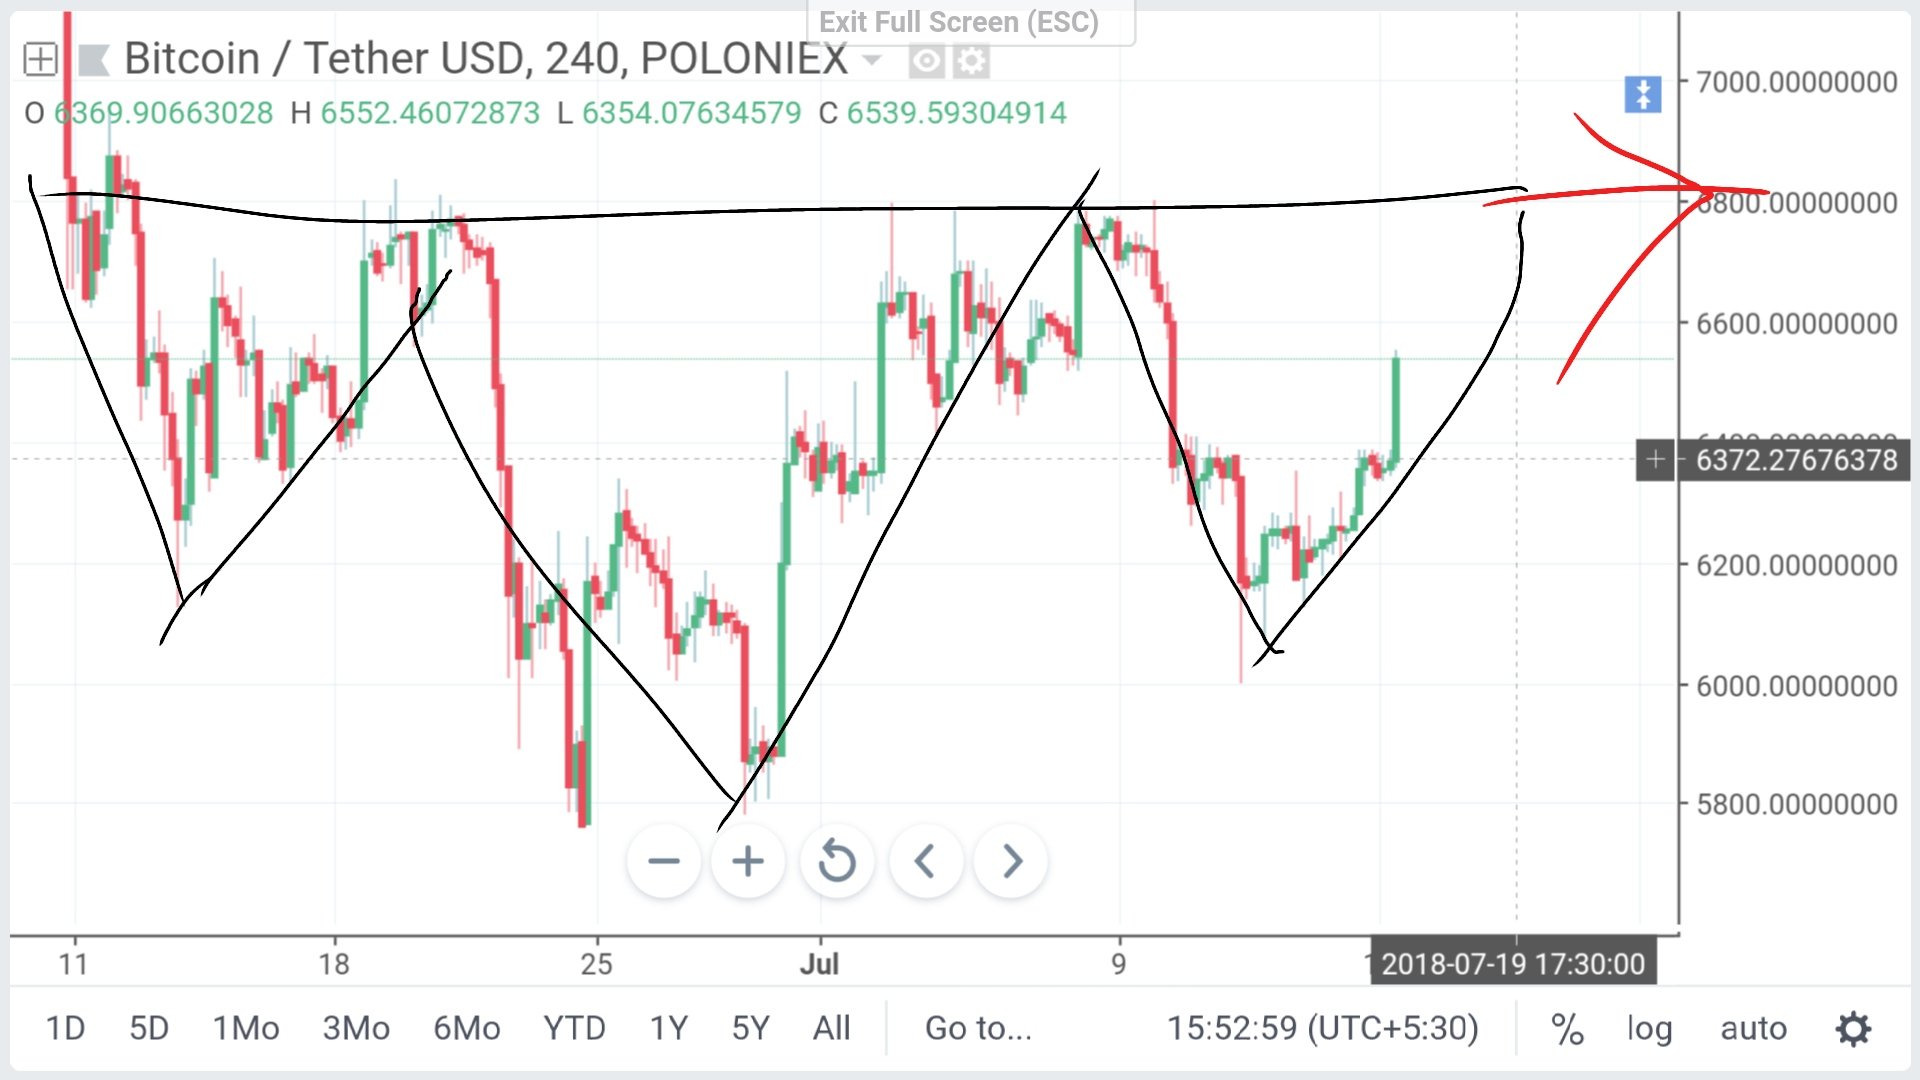
- The chart shows that Head and shoulder pattern that gonna complete. That indicated in chart. Left shouler and head is already completed and right shoulder compete than we can see little upside motion.
If it is not hold $6000 than it have achance to go below $5800. That is another support level.
Support level - $6039
Resistance level- $6400
Support level - $5800
Resistance level-$6800
But all the trend of today shows bullish.
And we know that for long term holding is most
profitable and bullish.
We expect that in the end of 2018 Bitcoin touch the level of $15000.
Thats all for today.
Here that all infirmation are only education purpose only.
Trading is do as per your own risk.
And do as according to berris of your loss.
If you like this information than upvote it and resteem my post.
If you have any question or query than comment me. I will try to solve.
Thank you.