Bitcoin Price Weekly Analysis – BTC/USD Primed for Gains

Key Points
Bitcoin price rocketed higher and moved above a major resistance at $8,500 against the US Dollar.
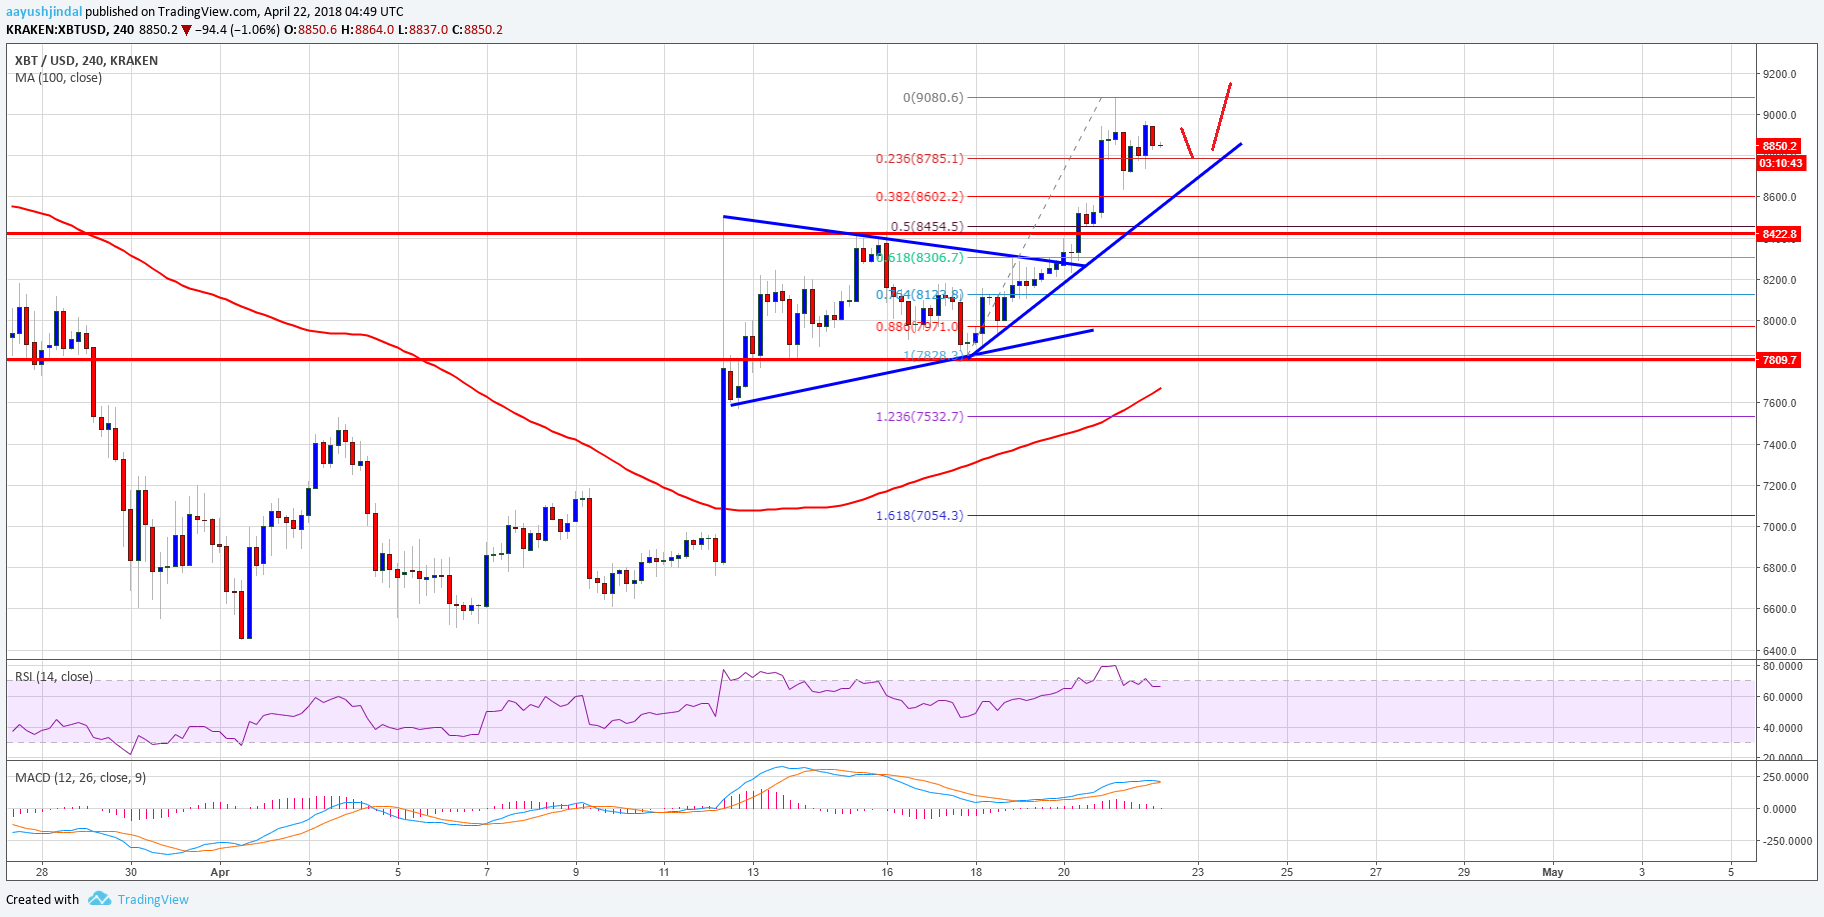
There is a connecting bullish trend line forming with support at $8,650 on the 4-hours chart of the BTC/USD pair (data feed from Kraken).
The pair is currently consolidating above $8,600 and it primed for more gains in the near term.
Bitcoin price is back in a bullish trend above $8,000 against the US Dollar. BTC/USD will most likely extend gains above $9,000 in the near term.
Bitcoin Price Support
This past week, there was a solid support base formed near $7,800 in bitcoin price against the US Dollar. The price started an upside move and broke the $8,500 resistance. It was a major move that pushed the price in a bullish wave towards the $9,000 level. It traded as high as $9,080 before sellers appeared. Later, a minor downside correction was initiated below $9,000.
BTC price tested the 23.6% Fib retracement level of the last wave from the $7,828 low to $9,080 high. However, the downside move seems to be limited by the $8,700 level. There is also a connecting bullish trend line forming with support at $8,650 on the 4-hours chart of the BTC/USD pair. Moreover, the 38.2% Fib retracement level of the last wave from the $7,828 low to $9,080 high is at $8,602. Therefore, there are many supports on the way down up to $8,600. Furthermore, the previous resistance at $8,500 may perhaps act as a strong support.
Looking at the chart, there is a significant uptrend in place above the $8,500 support. Once the current correction phase is over, the price will most likely bounce back towards $9,000. Above the stated $9,000, the price could even test the al-important $10,000 level.
Looking at the technical indicators:
4-hours MACD – The MACD for BTC/USD is slightly in the bullish zone.
4-hours RSI (Relative Strength Index) – The RSI is moving lower from the 80 level.
Major Support Level – $8,500
Major Resistance Level – $9,000
Tags: Bitcoin Analysis, bitcoin price, Bitcoin Price action, Bitcoin price analysis, Bitcoin price chart, bitcoin signals, bitcoin technical analysis, bitcoin trading, blockchain, btc, btcusd, btcusd price, daytrading, Opinion, trading, virtual currency