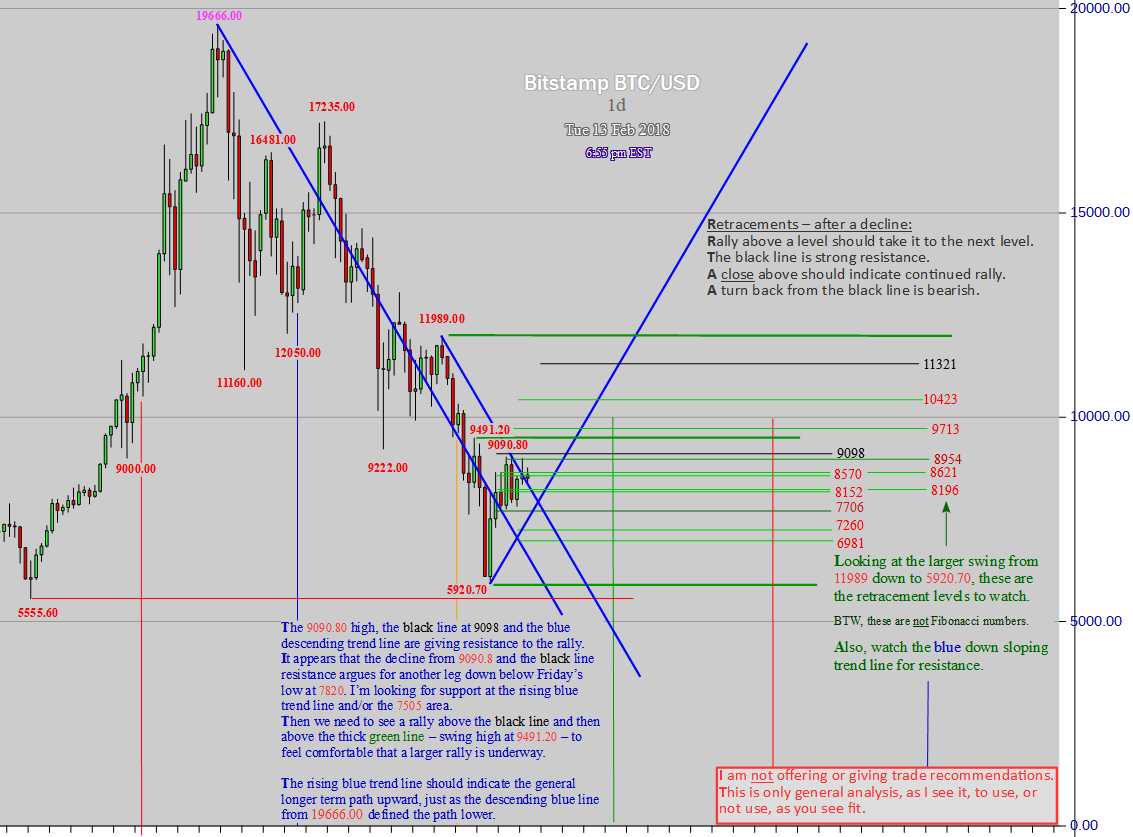
BTC Chart update
Today's action, so far (7pm EST), argues for another leg to the downside below Friday's low at 7820. The 7505 area would be a 50% retracement of the recent rally and the rising blue trend line can also act as support.
If you are trading this market, i would wait for the dip before buying; if you are an accumulator, any dips are a buy opportunity.
With a small trading range today and it being an inside day, tomorrows action is uncertain. IMO, the likely direction for tomorrow is down.
Last week's action -- ending 11 Feb '18 -- resulted in a 2.5% gain over the previous week.
The year to date (YTD) result -- ending 11 Feb '18 -- is down 38.05%
The change from the all time high (ATH) -- ending 11 Feb '18 -- is down 56.85%
all using Bitstamp quotes
[open the chart in a new tab for a larger view]

no recovery until after the new year! bad luck to invest at this time
Yeap, we both think the same, tomorrow might be a buy oportunity for acumulators, sadly the waves are not strong enough to allow a succesfull daytrade worth the risk.
If you don't mind meanwhile you are most welcome in my blog, where I keep an update on BTC, ETH, XRP, XVG, SC, and STEEM.