The bleeding stops tonight! 60 day BTC cycle over. Target $18,400+ by next week!
Ok. Let me explain what is going on in this noisy chart folks. I am sorry for all of the lines.
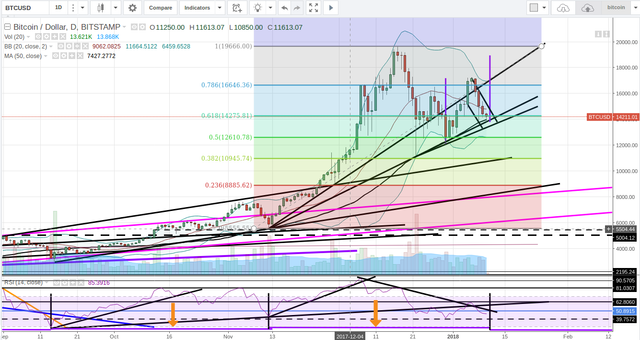
The lines that I would like to explain are:
1). The two up-trending blue supports near our 50 day MA.
These should stop us tonight. If we break through the first, we still have another. They are both very good support. Break 'em and we're going down to 11k. However, I don't think this will happen.
2). The purple lines in the bottom of the RSI between the black vertical.
The reason I don't think we'll break our support tonight is because all throughout 2017 BTC has followed a pattern that I've noticed: 60 day cycles (on average). For the first 40-45 days of this cycle, BTC trends up. Massively. For the remainder of the cycle (the last 15-20 days) BTC trends down. This has happened repeatedly. I've measured these 60 day cycles with those purple lines that I have orange arrows pointing at. The black vertical lines mark the beginning and ending of this cycle. Tonight marks the end of another one of these 60 day cycles.
My hunch is that by tomorrow morning the bulls will show up in full force again.
3). The vertical purple lines:
These are fractals. I have measure the up-movement of the last trend from BTC's lowest point to highest. We then formed another clear downtrend channel. Perfect! A good sign that fractals will work in our favor to show us our next short term target. I clone my first fractal and set it at BTC's current low within that down channel (bottom-most of the 4 red bars). This shows me that our new near term target will be anywhere from $18,400-18,800. I suspect we hit this target sometime next week.
Get your buy orders lined up. We are in the buy zone now.
Happy trading all!