steem/btc trading H4/D1/W1 on HitBTC (1-20-2018)
By @steemitnoticias January, 2018.
Important note:
This is a small amateur analysis with the purpose of informing, entertaining and giving an opinion on how the steem coin goes compared to bitcoin in the most common times. It is a small contribution from me, but I am not encouraging you to negotiate with the currency. Nor forcing anyone to buy it. It is your responsibility as interpreted. I saw it in the following way.
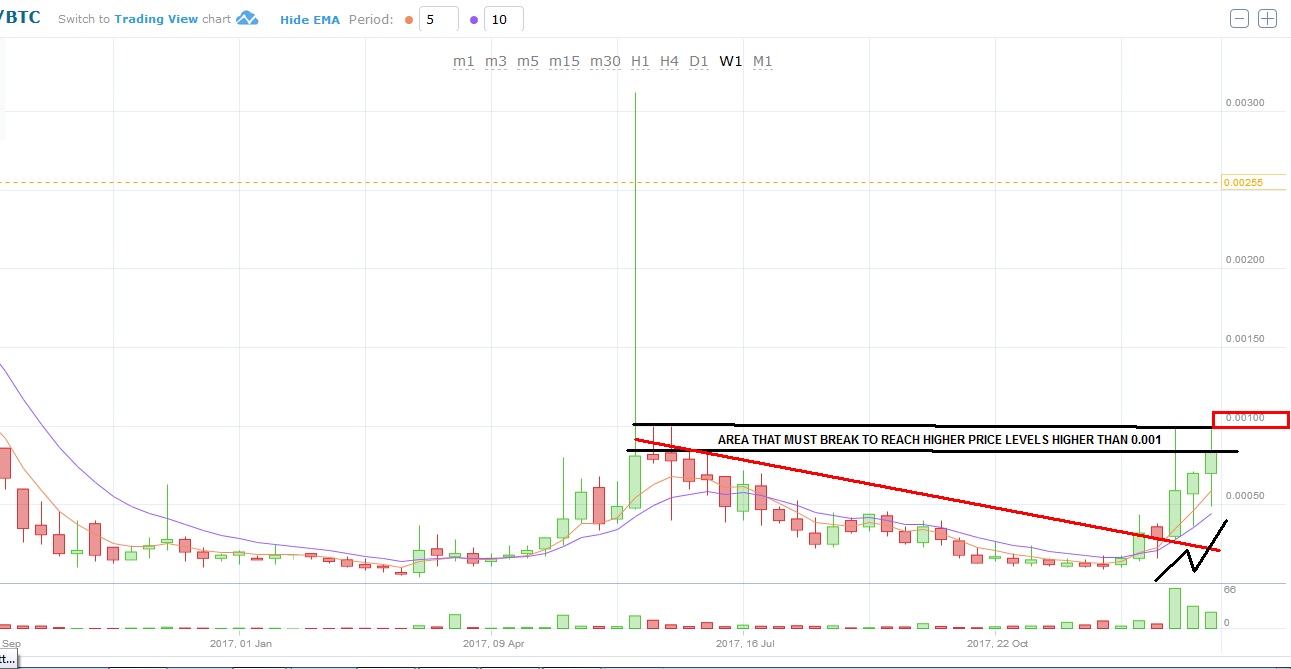
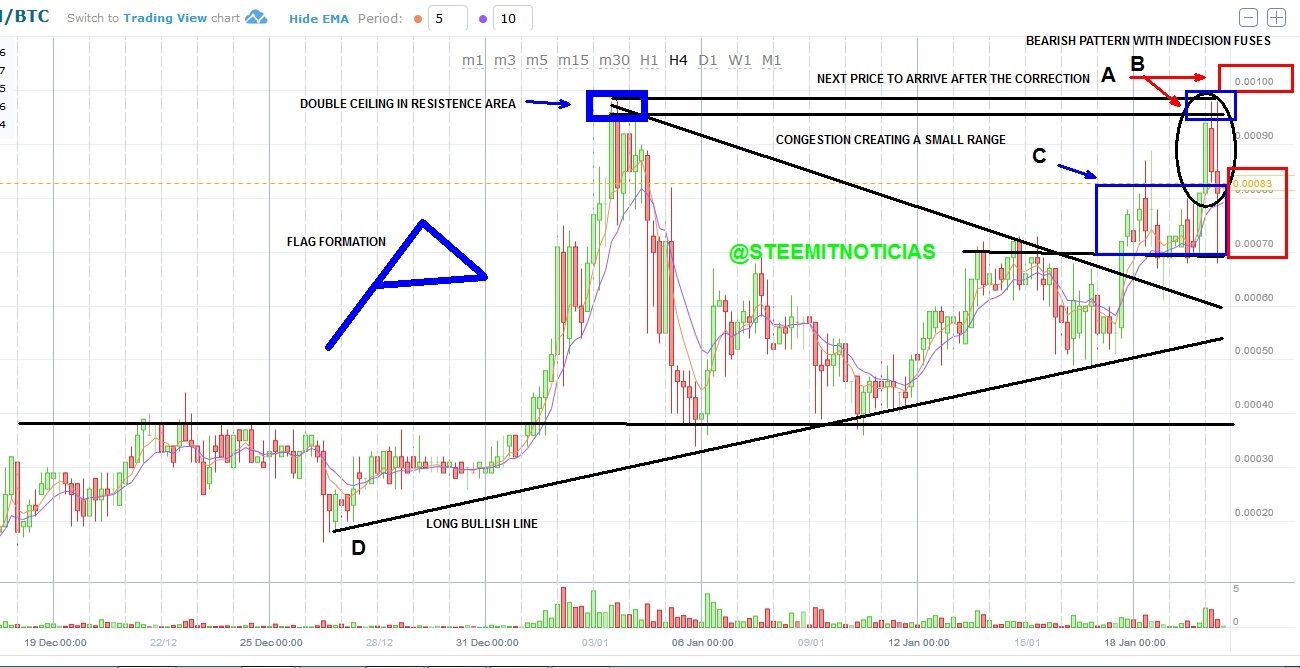
A pennant formation that was blown long before. The graph in 4h can be seen a clear bearish pattern, in a double resistance ceiling. That means that the price can be kept down in the last hours of this day. Even the last candle has both wicks above or below, which indicates indesicion. In my opinion, the price will remain today a few days between a price range that marks in red from 0.0083 to 0.0070. That congestion will remain and then rise little by little until you reach prices of 0.001. Clearly, you should create a clear upward pattern in a shorter time. Clearly, you should create a clear upward pattern in a shorter time. Of the same
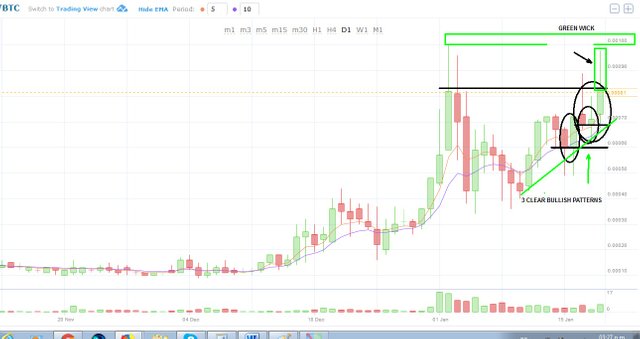
In the one day chart, although the green candle has a rejection wick, it still keeps it green. That type of candles indicates that the price made its correct correction but that in a short time it will return to the maximum price that arrived in a gradual way. A clear pattern of continuation until in a day does not form a bearish pattern.