The fall of Cryptos - history repeating itself?!
Alright, so this will be a relatively short one. Behold! 2017 September China FUD.

CHART 1: So the market hit an all time high after a very quick rise over the course of 6 weeks. July 16th, 2017 (61 Billion) to Sep 2nd, 2017 (178 Billion).
A rise of 290% percent over 6 weeks...after which it came crashing down in 3 steps. See those 3 mountain tops? It took about 5 weeks for the market to go back to the 3rd and lowest top and then another 2 weeks to go back to where it was before the big crash. 6 weeks up. Hard crash down. 7 weeks back up...now why does this look so familiar?
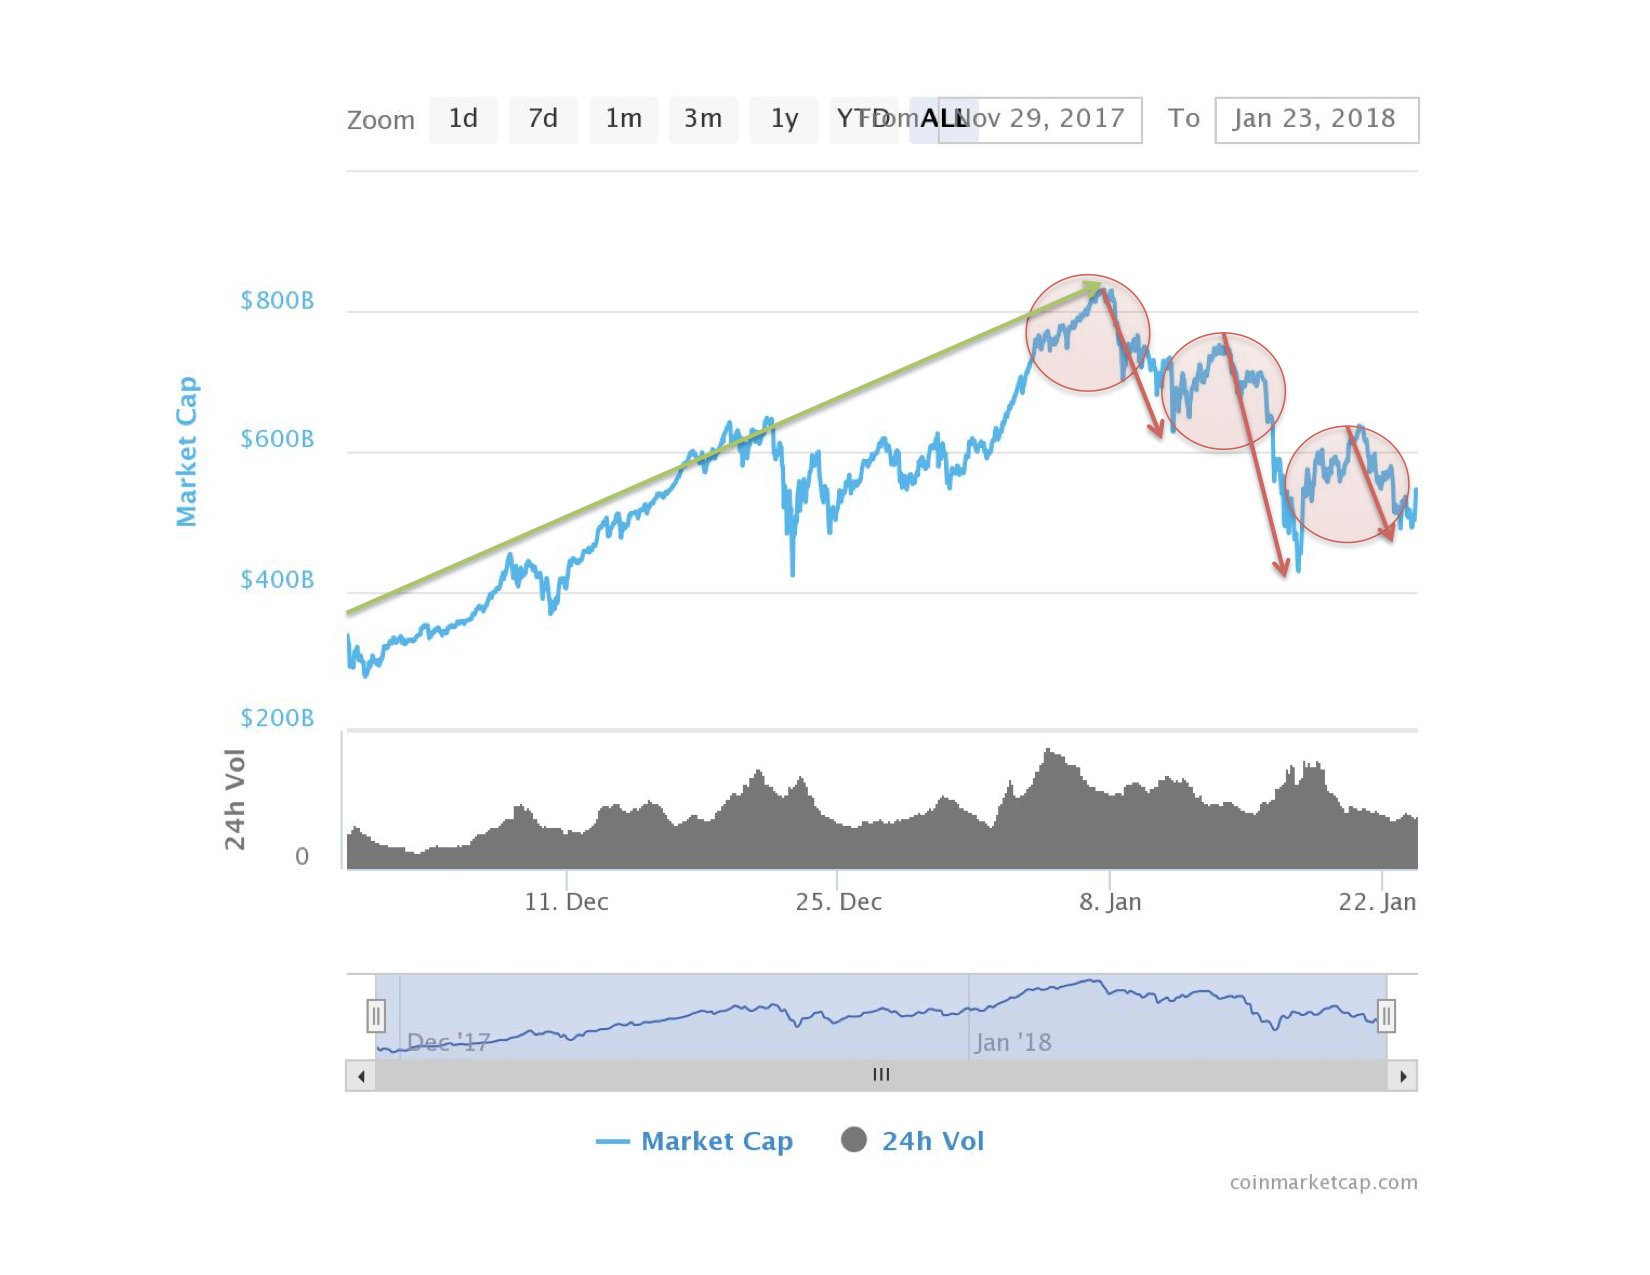
CHART 2: Nov 30th, 2017 (281 Billion Market Cap) - Jan 7th, 2018 (830 Billion). A rise of 295% over 5 weeks, then a crash in 3 steps. See those 3 mount...ok, I am repeating myself :) Granted, this ride was bumpier on the way up...a few pretty scary falls along the road. However, if just for a brief moment, we will entertain the thought that history repeats itself, we may be experiencing the last correction. That said, it is quite possible that the tumble from the 3rd mountain top is not over yet. Will we see another one? Maybe. I don't know...but I remain optimistic in regards to what happens after we are done with these corrections. "Houston, we are clear for takeoff"