How To Profit From the Dip

Right now Bitcoin and most all other cryptocurrencies are in a big fall, but you can still profit through trading. Just look at all these places where Bitcoin moves up, even in the bear market. If only you could predict when it goes up, then you could buy low and sell high!

Well, here I can show you a simple strategy of trading that can help you profit from the dip.
DISCLAIMER: This is not professional trading advice
This strategy doesn't require you to stare at your computer screen all day; it isn't day trading. It's swing trading, basically making, on average, one trade per day.
So let's get started!
First you'll need to pull up a price chart, I would highly recommend https://www.tradingview.com/ and will base this guide around that.
So pull go to https://www.tradingview.com/ and click on the search bar at the top. Here you can type in the ticker of your currency and then USD, so for example, type in ETHUSD for Ethereum's price chart. For this guide I will be using BTCUSD, but you can use anything you want, even a stock!

Now click on "interactive chart," located inside the chart on the bottom left of your screen.
Now you should see a chart of Bitcoin price! First, go to the top left of the screen and change the dropdown next to the symbol to be 2 hours. This places your chart on a good scale, perfect for swing trading.

Now you can navigate around this chart by clicking and dragging or using the mouse wheel to zoom in or out.
This is great for looking at the Bitcoin price over time, it is much better than coinmarketcap's chart, but it is not enough. You can learn a lot by just looking at this graph, but it is difficult to tell when to buy or sell. So that is why we are going to use an indicator!
What is an Indicator?
An indicator basically takes all the data on the chart, and changes it into something that is easier for humans to deal with.
We will be using an indicator called the Relative Strength Index (RSI) to figure out when the price is overextended.
So let's put that indicator on our chart!

Click on the 'Indicators' button in the top bar of your screen.
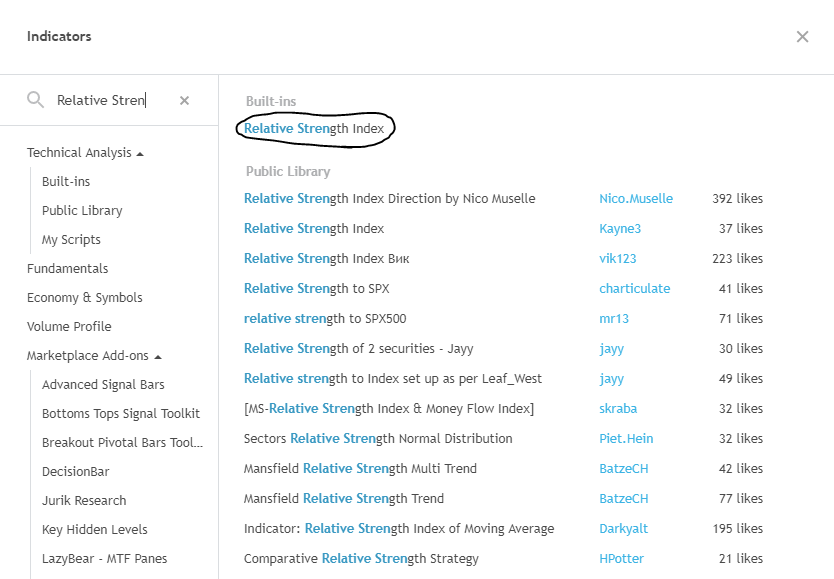
Next, search "Relative Strength Index" in the menu that pops up. Click on "Relative Strength Index" under Built-ins.
You should see a purple tab on the bottom of your screen now! That is the relative strength index. If you look on the chart, whenever the line drops outside of the purple region, the price goes up. This happened very recently, in fact, and the price went up 10%!

Why does this happen?
Well, it is difficult to explain, but basically the Relative Strength Index shows when the price is very under- or over-valued.
Whenever the line goes above the purple region, it shows that the coin is overvalued, and the price will most likely drop soon. So that's a big sell signal.
But whenever the line goes below the purple region, it shows the coin is undervalued, and the price will most likely rise soon. So that's a big buy signal.
To trade using this, check in every so often and see if the Relative Strength Index is low. If it is getting very close to outside the purple region, then you should keep an eye on it, because there might be a great buy setup coming.
But make sure not to trade with all of your money, only use a portion of it, because this is a very tricky business and you can lose your money fast.
Follow me @shredz7 if you like this content! Resteem if you think your followers will like this. Comment about your thoughts on this article, and if you want to read more, check out one of my previous posts on the power of the hash, the foundation of Bitcoin!
Image by David McBee @ pexels with license CC0
For future viewers: price of bitcoin at the moment of posting is 8410.60USD