You are viewing a single comment's thread from:
RE: Bitcoin is Selling Off - But This is why you Should Relax
Good points, have you seen the macd divergence on daily chart? looks like this was expected move
Good points, have you seen the macd divergence on daily chart? looks like this was expected move
MACD indicators aren't really something I look at but I'm interested to see it on your chart if you'd be keen to share a screenshot and an explanation?
Sure, here you go !
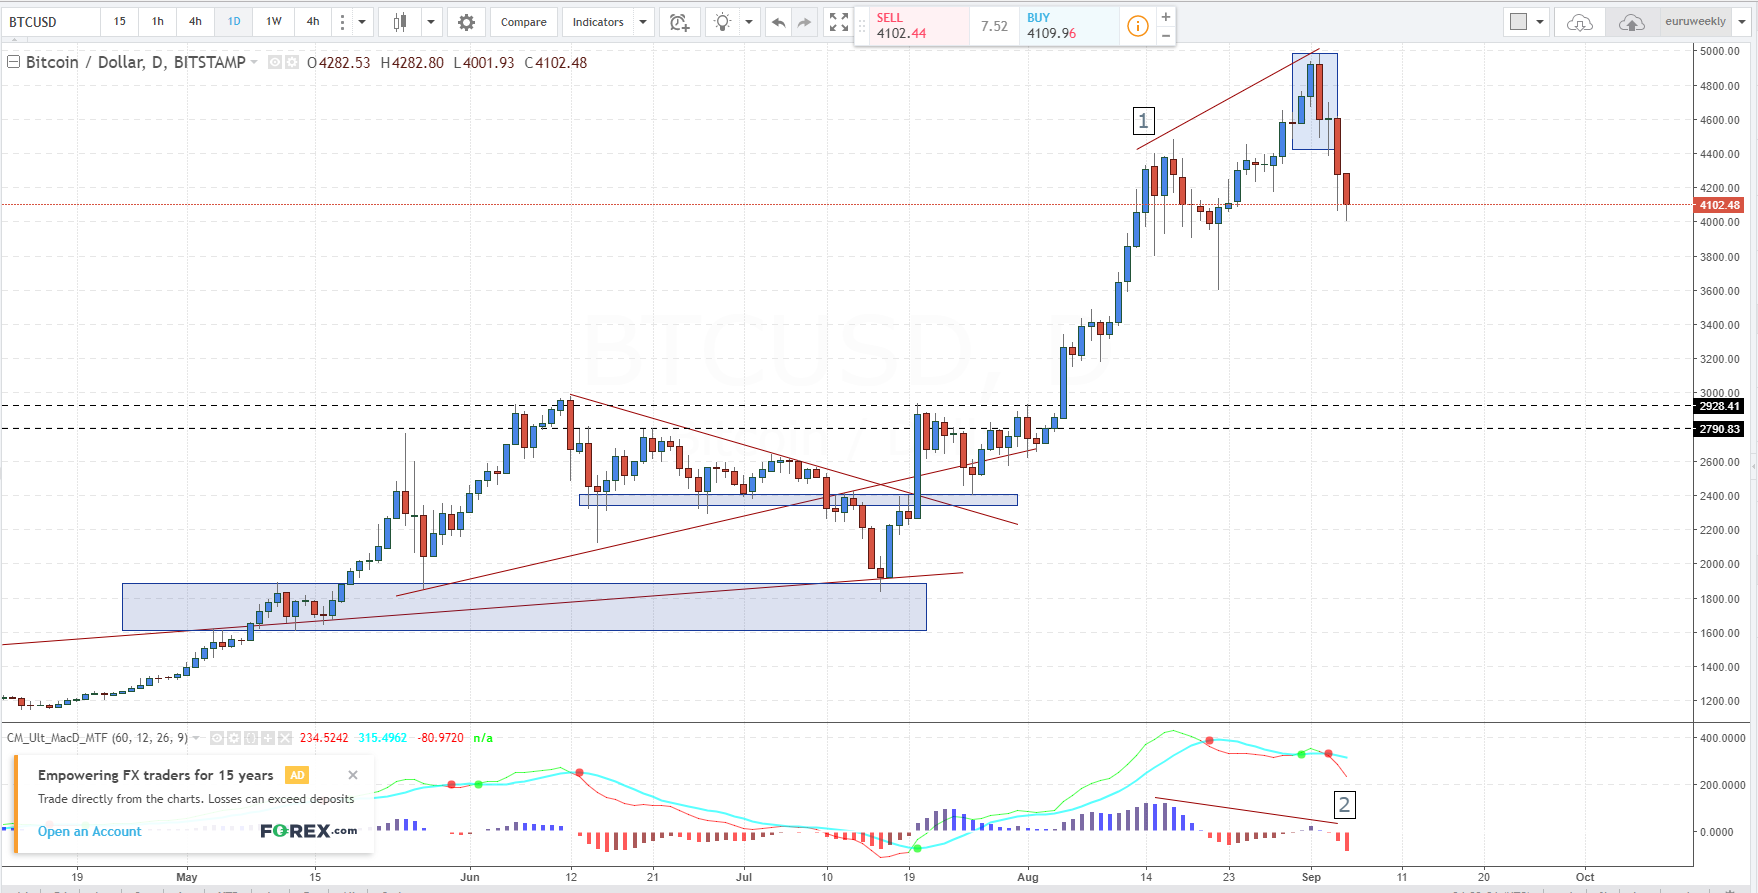
As you can see, price is making higher highs, MACD is in opposite direction indicating weakness in the trend. In addition, we can see strong bearish engulfing pattern (rectangle box on top).