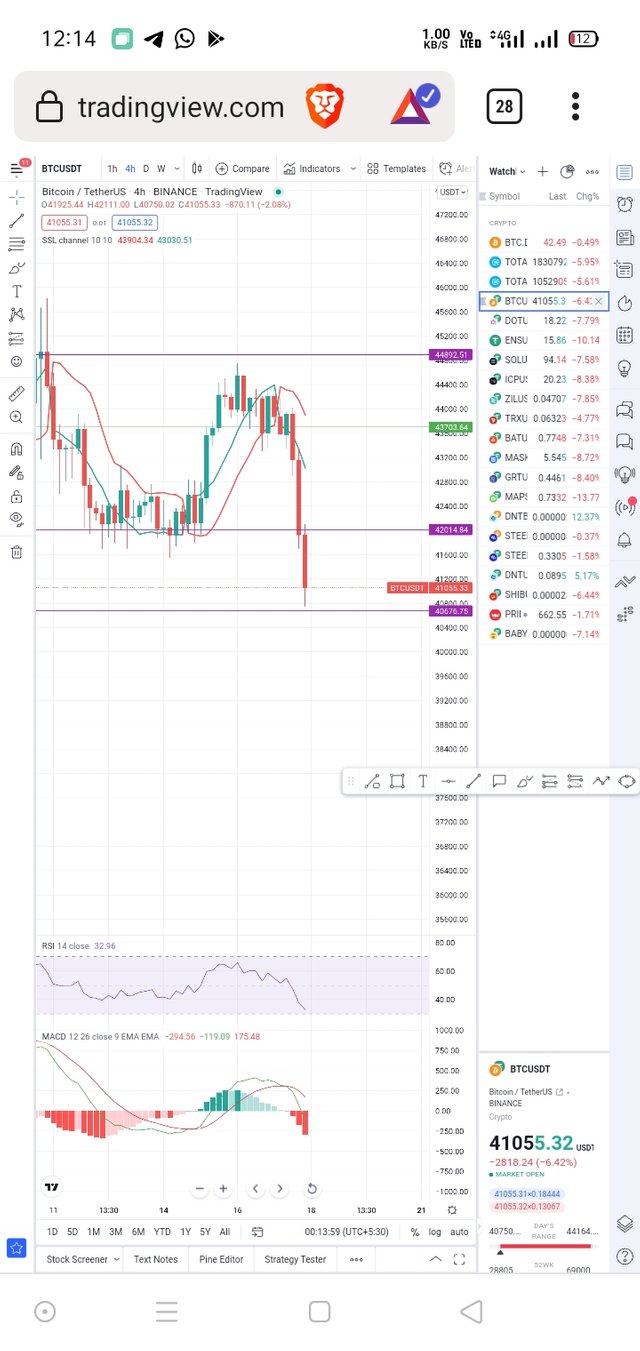
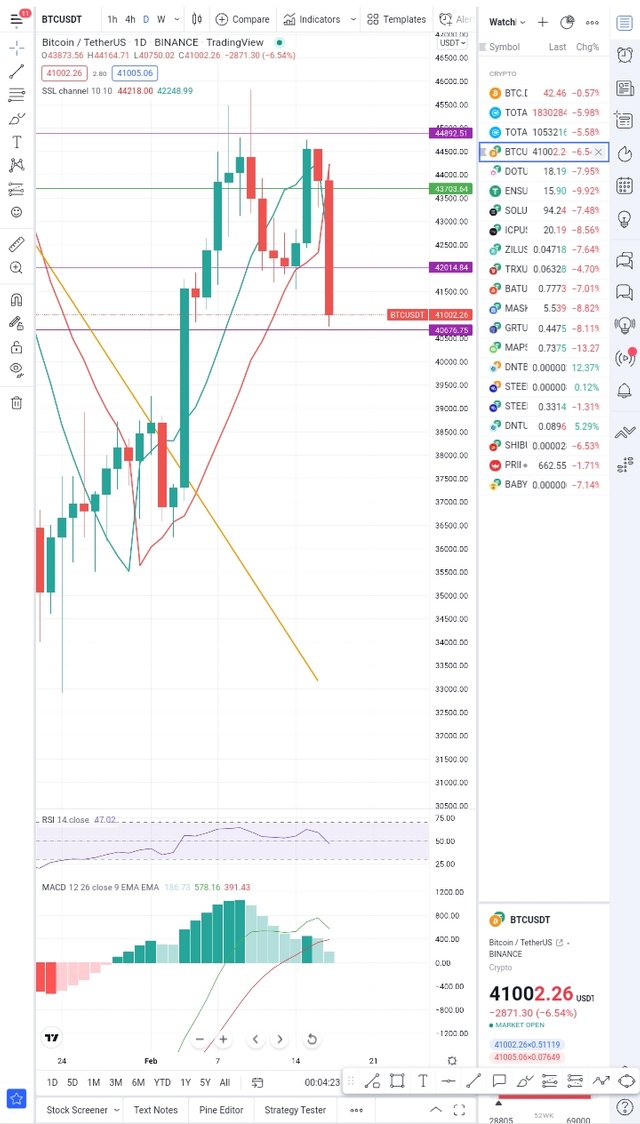
Bitcoin chart analysis
As in chart, btc has broke 42000$ level and starts bearish move. In 1h and 4h time frame macd crossover has taken place and in 1d timeframe macd can crossover. The next support of btc will be 40600$ which is very crucial level below which bear trend will start.
All financial markets taking red bath because of tension between russia and ukrain.

