Bitcoin v USD daily candlestick chart for 11th October 2017
The price is co close to $5,000 on this daily chart, surely it has to break through this time? Worst case scenario for the bulls is a double top but there's probably short stops above $5,000 and it will be interesting to see what happens around there. How long can the new uptrend last? Interesting to see how parallel it looks to the last one. I'm holding some bitcoin but still have a variety of altcoins, including Steem. Hope they can join the party.
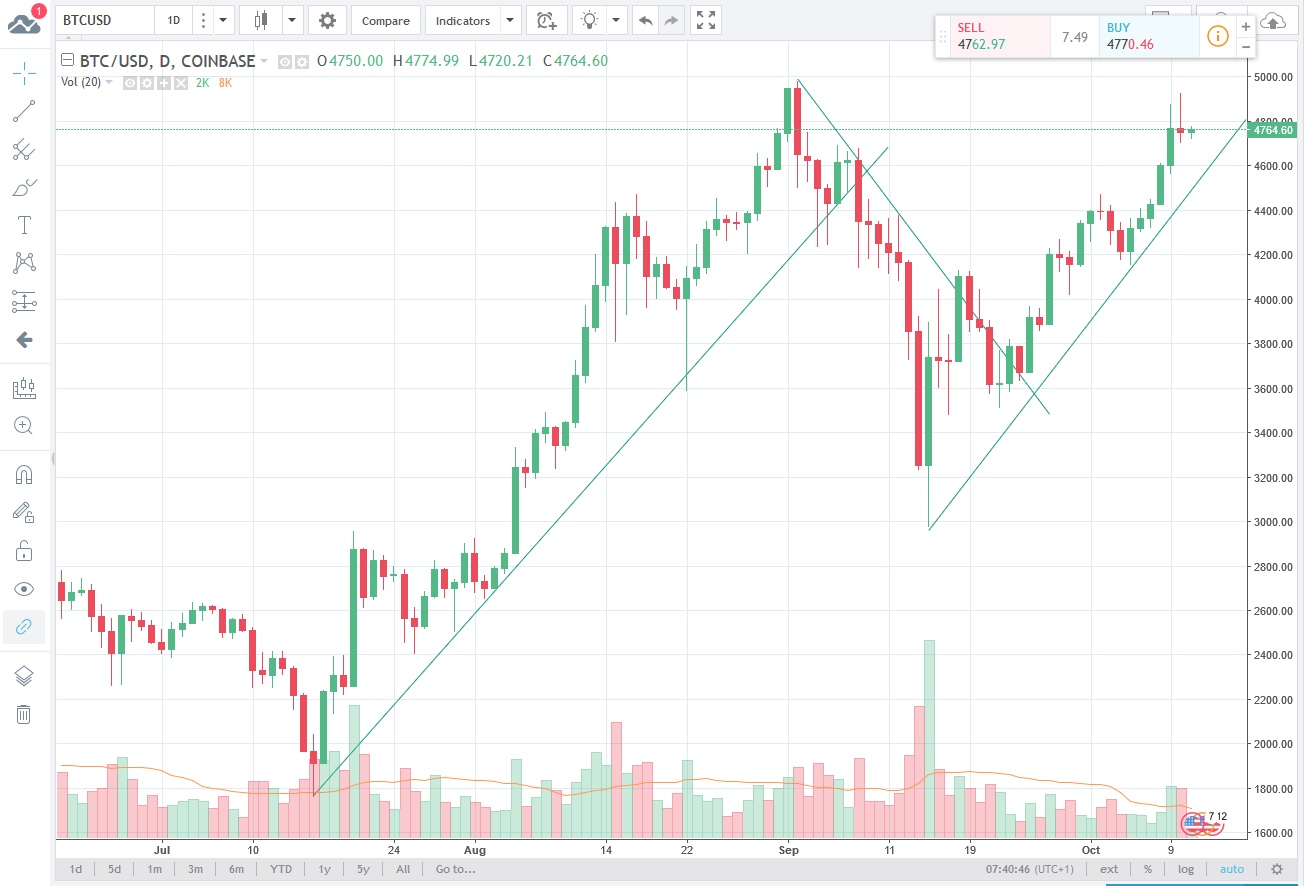
The chart is from https://uk.tradingview.com/chart/, free to register and nice to use. I drew the lines on.
@minnowpond1 has voted on behalf of @minnowpond. If you would like to recieve upvotes from minnowponds team on all your posts, simply FOLLOW @minnowpond.